


Welcome to BAAD World
BAAD (Brain Anatomical Analysis using Diffeomorphic deformation) is based on a VBM (voxel-based morphometry) algorithm to extract features of the brain shape. It runs on Windows OS and requires no special preparation. Download and use it freely. It comes standard with AAL, Brodmann, and LPBA40 regions of interest (ROIs), as well as independently created regions of interest for white matter and white matter lesions (deep white matter and periventricular white matter). Users can also create their own ROIs and register them in BAAD. In addition to statistical analysis, z-values and volumes (ml) for each ROI are calculated.
BAAD supports the clinical diagnosis of Alzheimer's disease (AD) from brain MRI. The BAAD-AI, which have been trained using the North American ADNI database, outperformed radiologists for AD diagnosis in a structural brain MRI review.
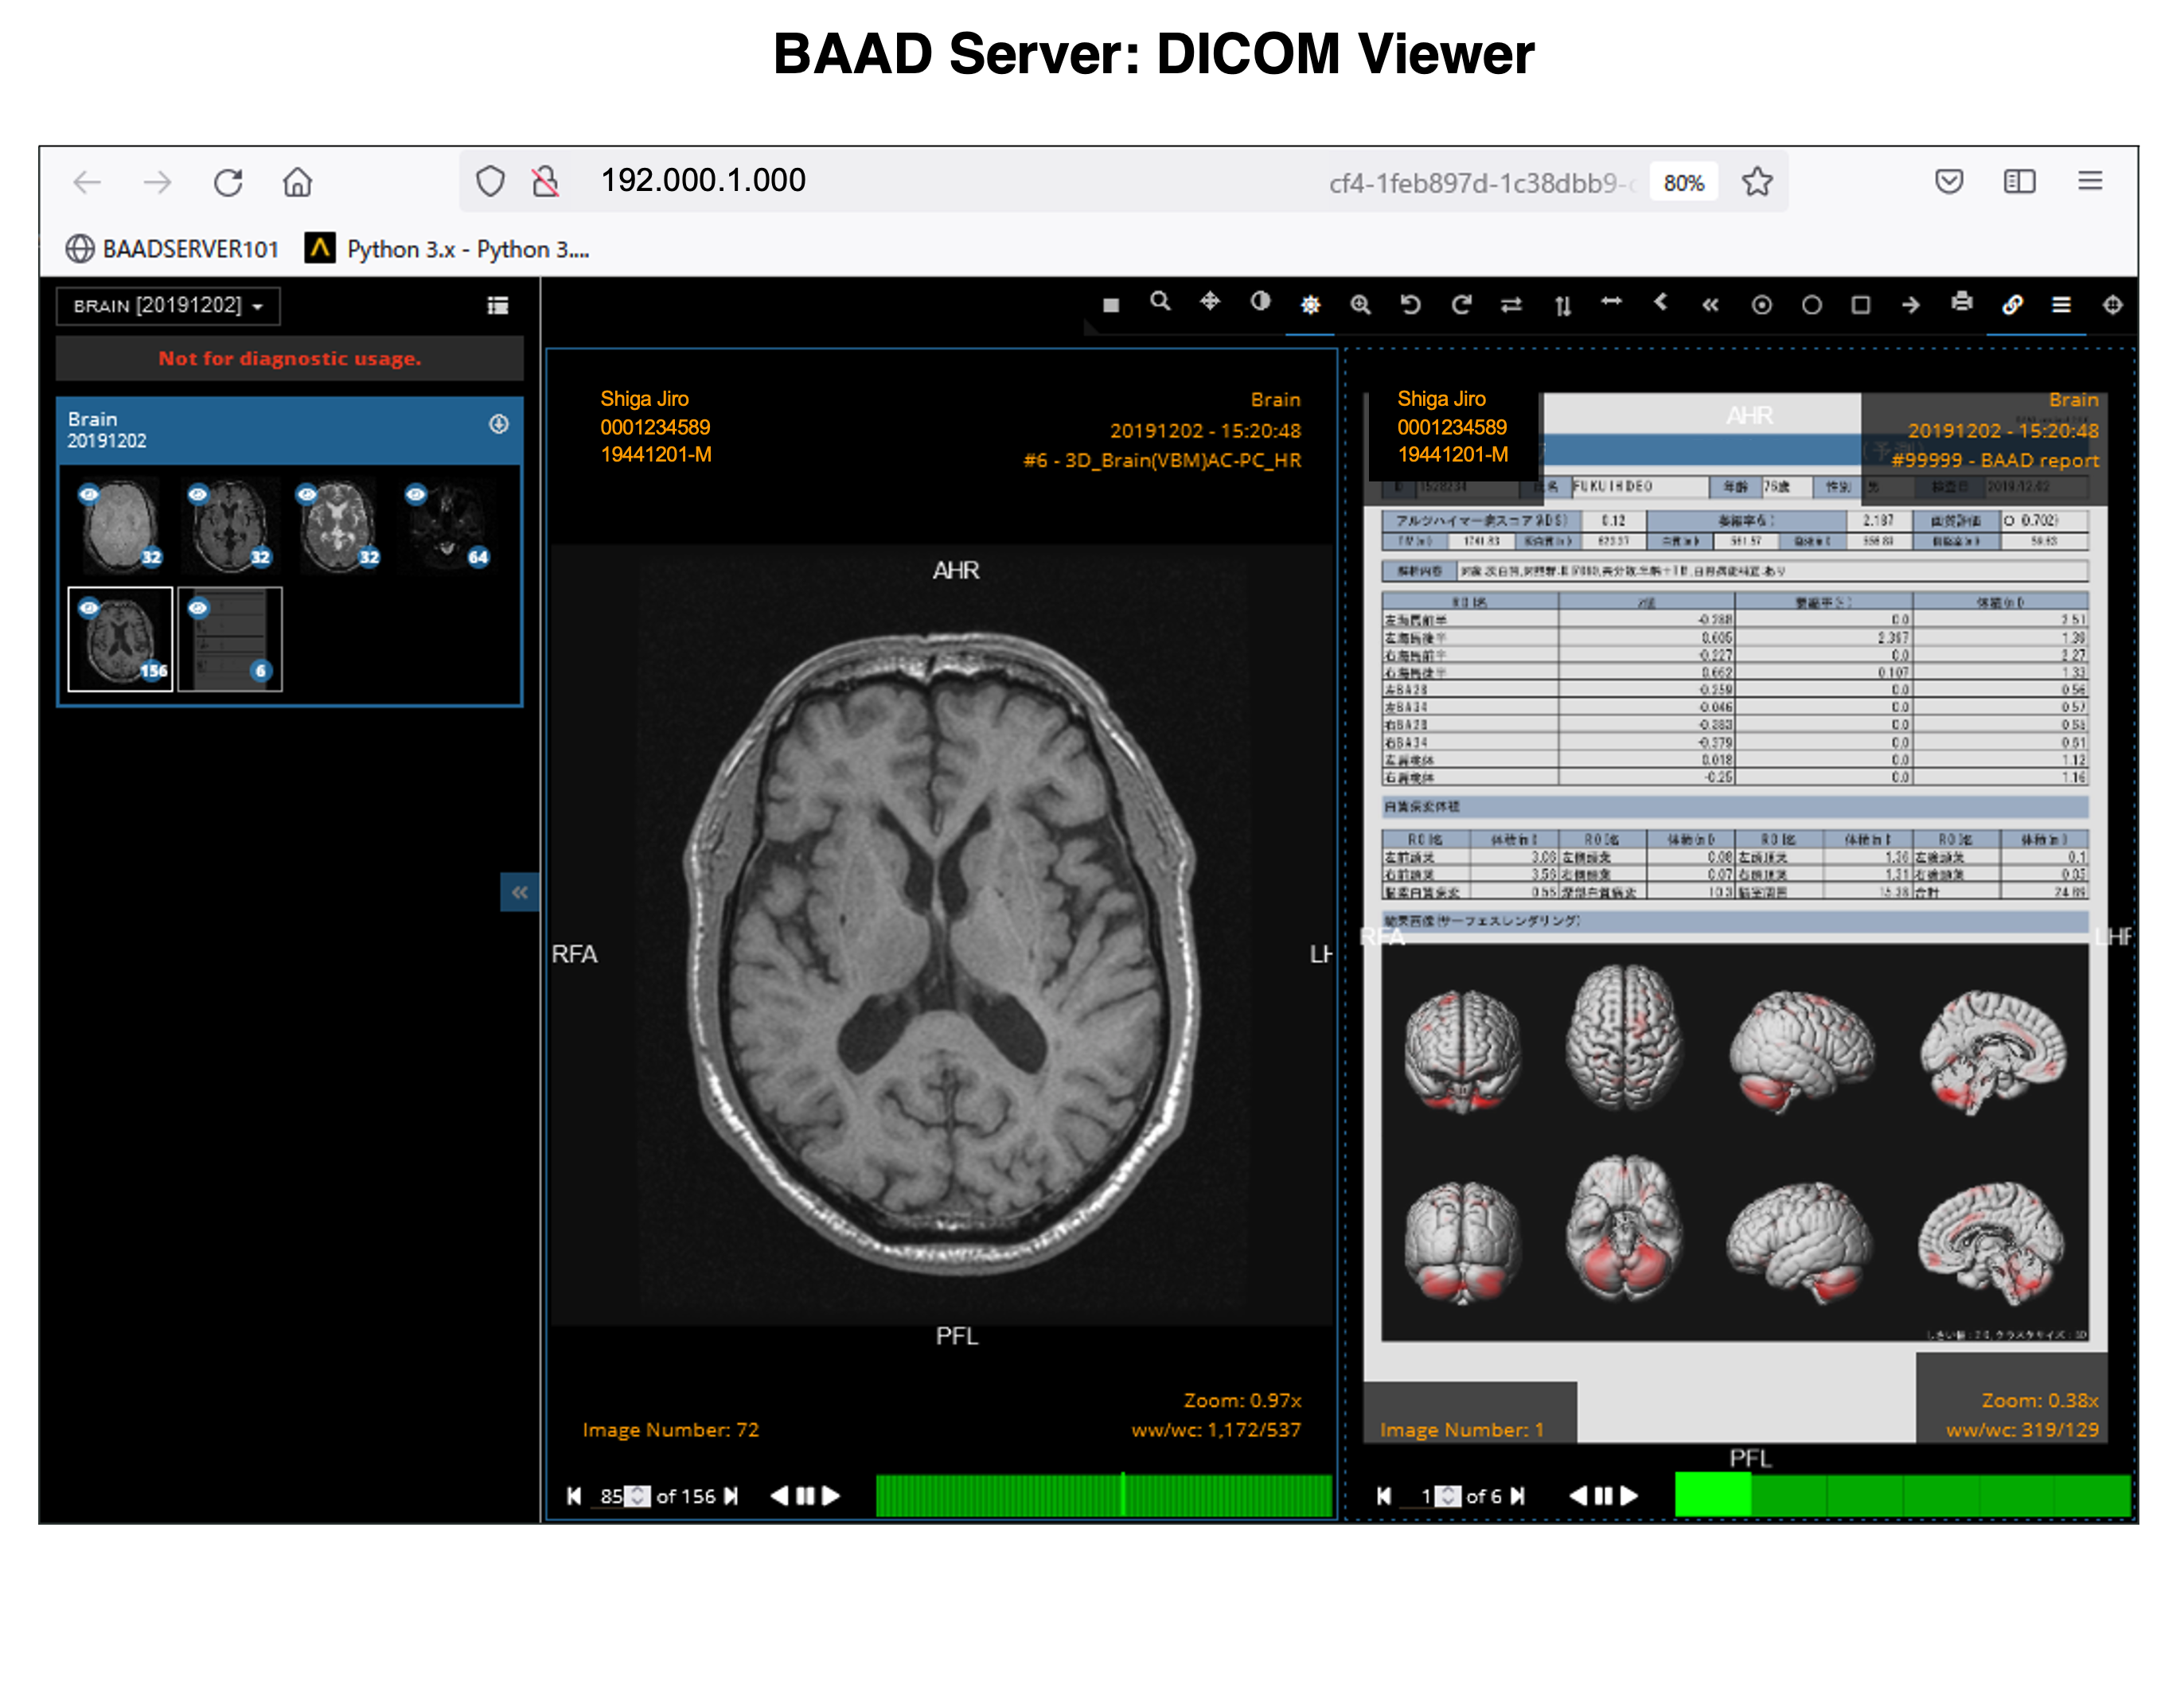
BAAD server can be installed in hospitals. This enables automatic BAAD analysis and reduces the daily workload of the hospital. Medical doctors can check the results of the BAAD along with the ordered MRI images via PACS. Furthermore, when the BAAD viewer is installed on a PC using as an electronic medical record, various analyses can be performed on the spot. For example, inputting the MMSE score will help the clinical diagnosis or doctors can change the brain section and threshold at will. Data is managed and stored on a case-by-case basis, and the data are passed to the BAAD-AI that deals with time series, helping to predict disease onset.
BAAD is also useful for research. Through BAAD, SPM12 and CAT12 can be used freely without installing Matlab. You can convert multiple series of DICOM data into NIfTI files at once, or edit DICOM files while viewing the images. If FLAIR images of the same case exist, they can be automatically paired with 3DT1-weighted images during segmentation for highly accurate segmentation, and white matter lesions can be measured by region.


Welcome to BAAD World
BAAD (Brain Anatomical Analysis using Diffeomorphic deformation) is based on a VBM (voxel-based morphometry) algorithm to extract features of the brain shape. It runs on Windows OS and requires no special preparation. Download and use it freely. It comes standard with AAL, Brodmann, and LPBA40 regions of interest (ROIs), as well as independently created regions of interest for white matter and white matter lesions (deep white matter and periventricular white matter). Users can also create their own ROIs and register them in BAAD. In addition to statistical analysis, z-values and volumes (ml) for each ROI are calculated.
BAAD supports the clinical diagnosis of Alzheimer's disease (AD) from brain MRI. The BAAD-AI, which have been trained using the North American ADNI database, outperformed radiologists for AD diagnosis in a structural brain MRI review.
BAAD server can be installed in hospitals. This enables automatic BAAD analysis and reduces the daily workload of the hospital. Medical doctors can check the results of the BAAD along with the ordered MRI images via PACS. Furthermore, when the BAAD viewer is installed on a PC using as an electronic medical record, various analyses can be performed on the spot. For example, inputting the MMSE score will help the clinical diagnosis or doctors can change the brain section and threshold at will. Data is managed and stored on a case-by-case basis, and the data are passed to the BAAD-AI that deals with time series, helping to predict disease onset.
BAAD is also useful for research. Through BAAD, SPM12 and CAT12 can be used freely without installing Matlab. You can convert multiple series of DICOM data into NIfTI files at once, or edit DICOM files while viewing the images. If FLAIR images of the same case exist, they can be automatically paired with 3DT1-weighted images during segmentation for highly accurate segmentation, and white matter lesions can be measured by region.


AI for Alzheimer's disease
AI for Alzheimer's disease

BAAD-AI outperformed radiologists for AD diagnosis in a structural magnetic resonance imaging review. (See references)

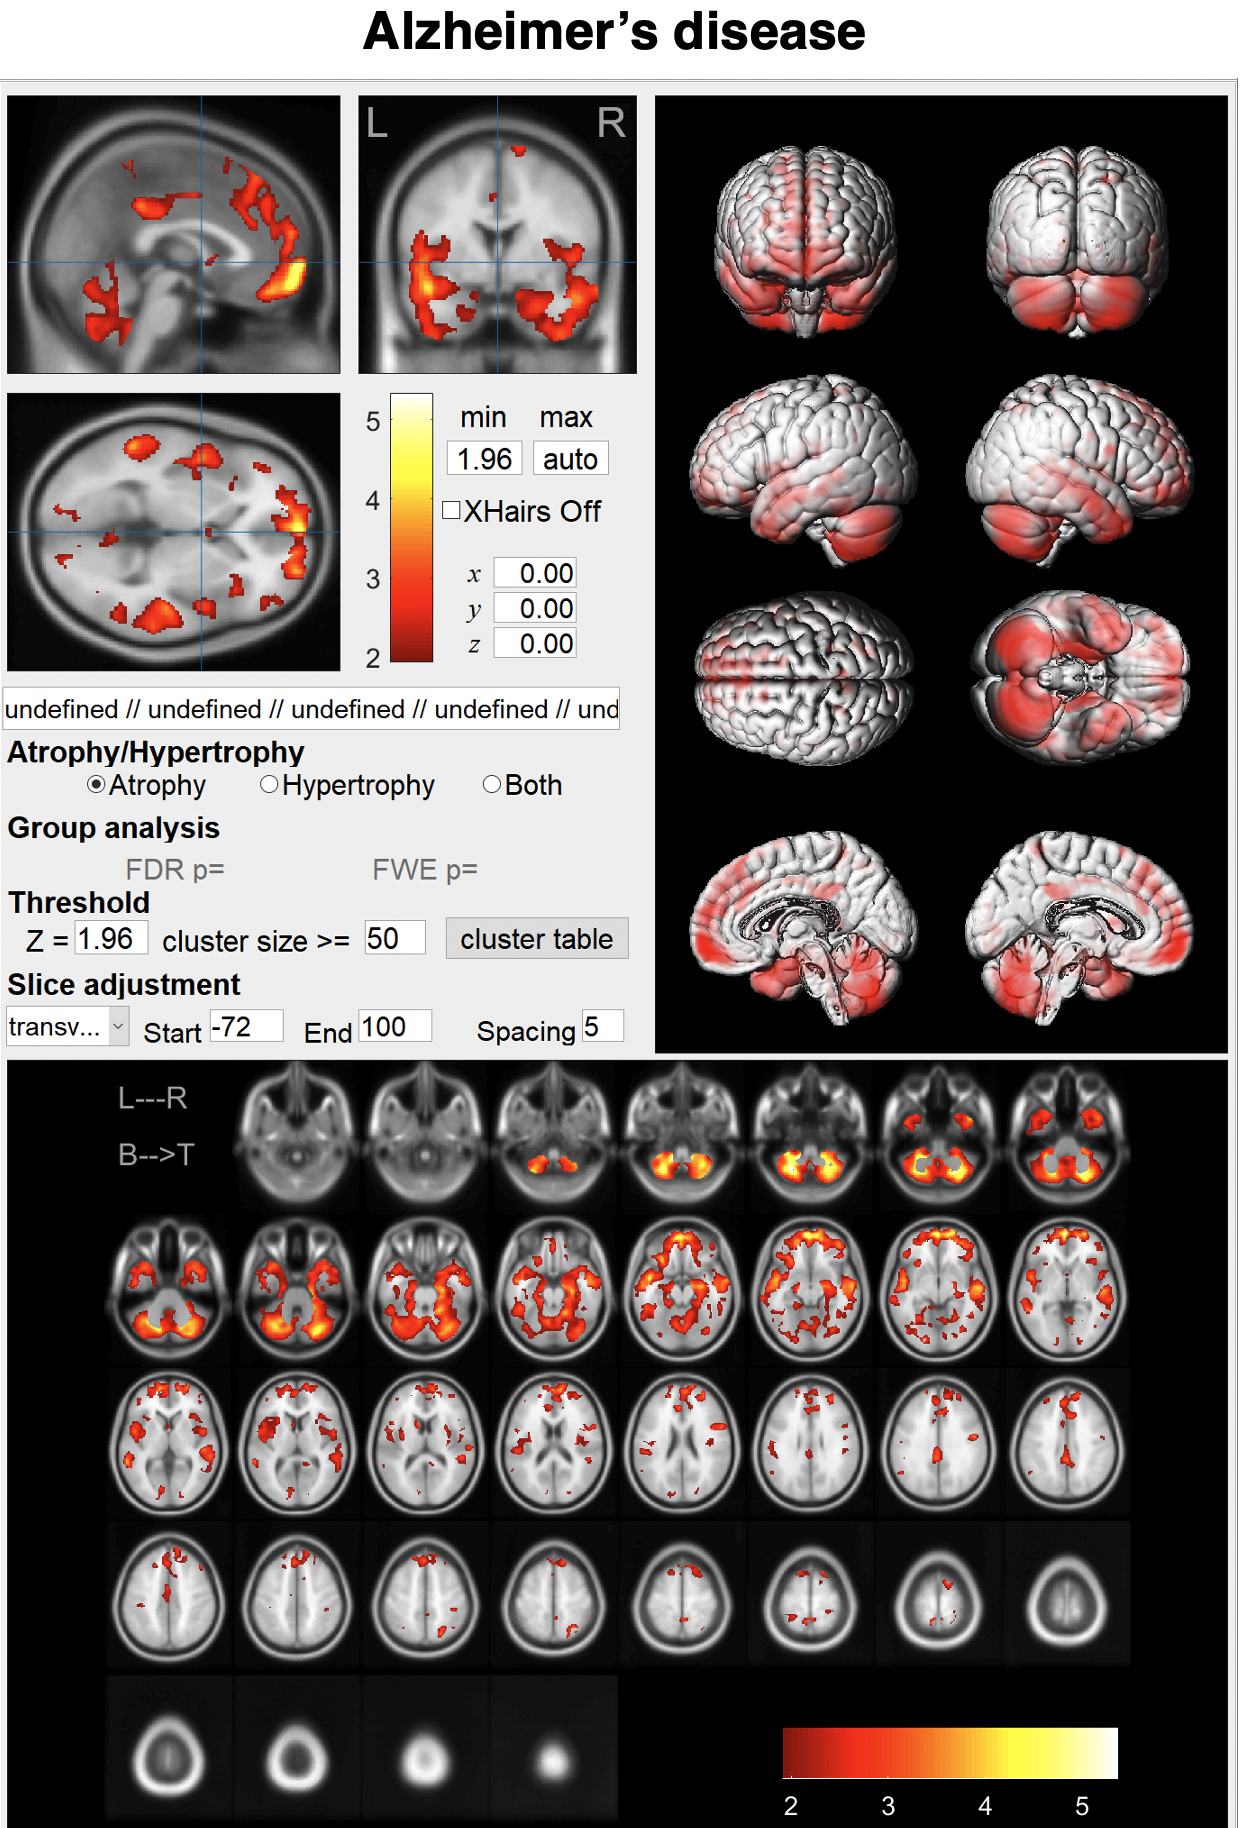
BAAD supports AD diagnosis
BAAD-AI outperformed radiologists for AD diagnosis in a structural magnetic resonance imaging review. The accuracy of the radiologists was 60-70%, respectively, whereas that of the BAAD-AI was 90%.
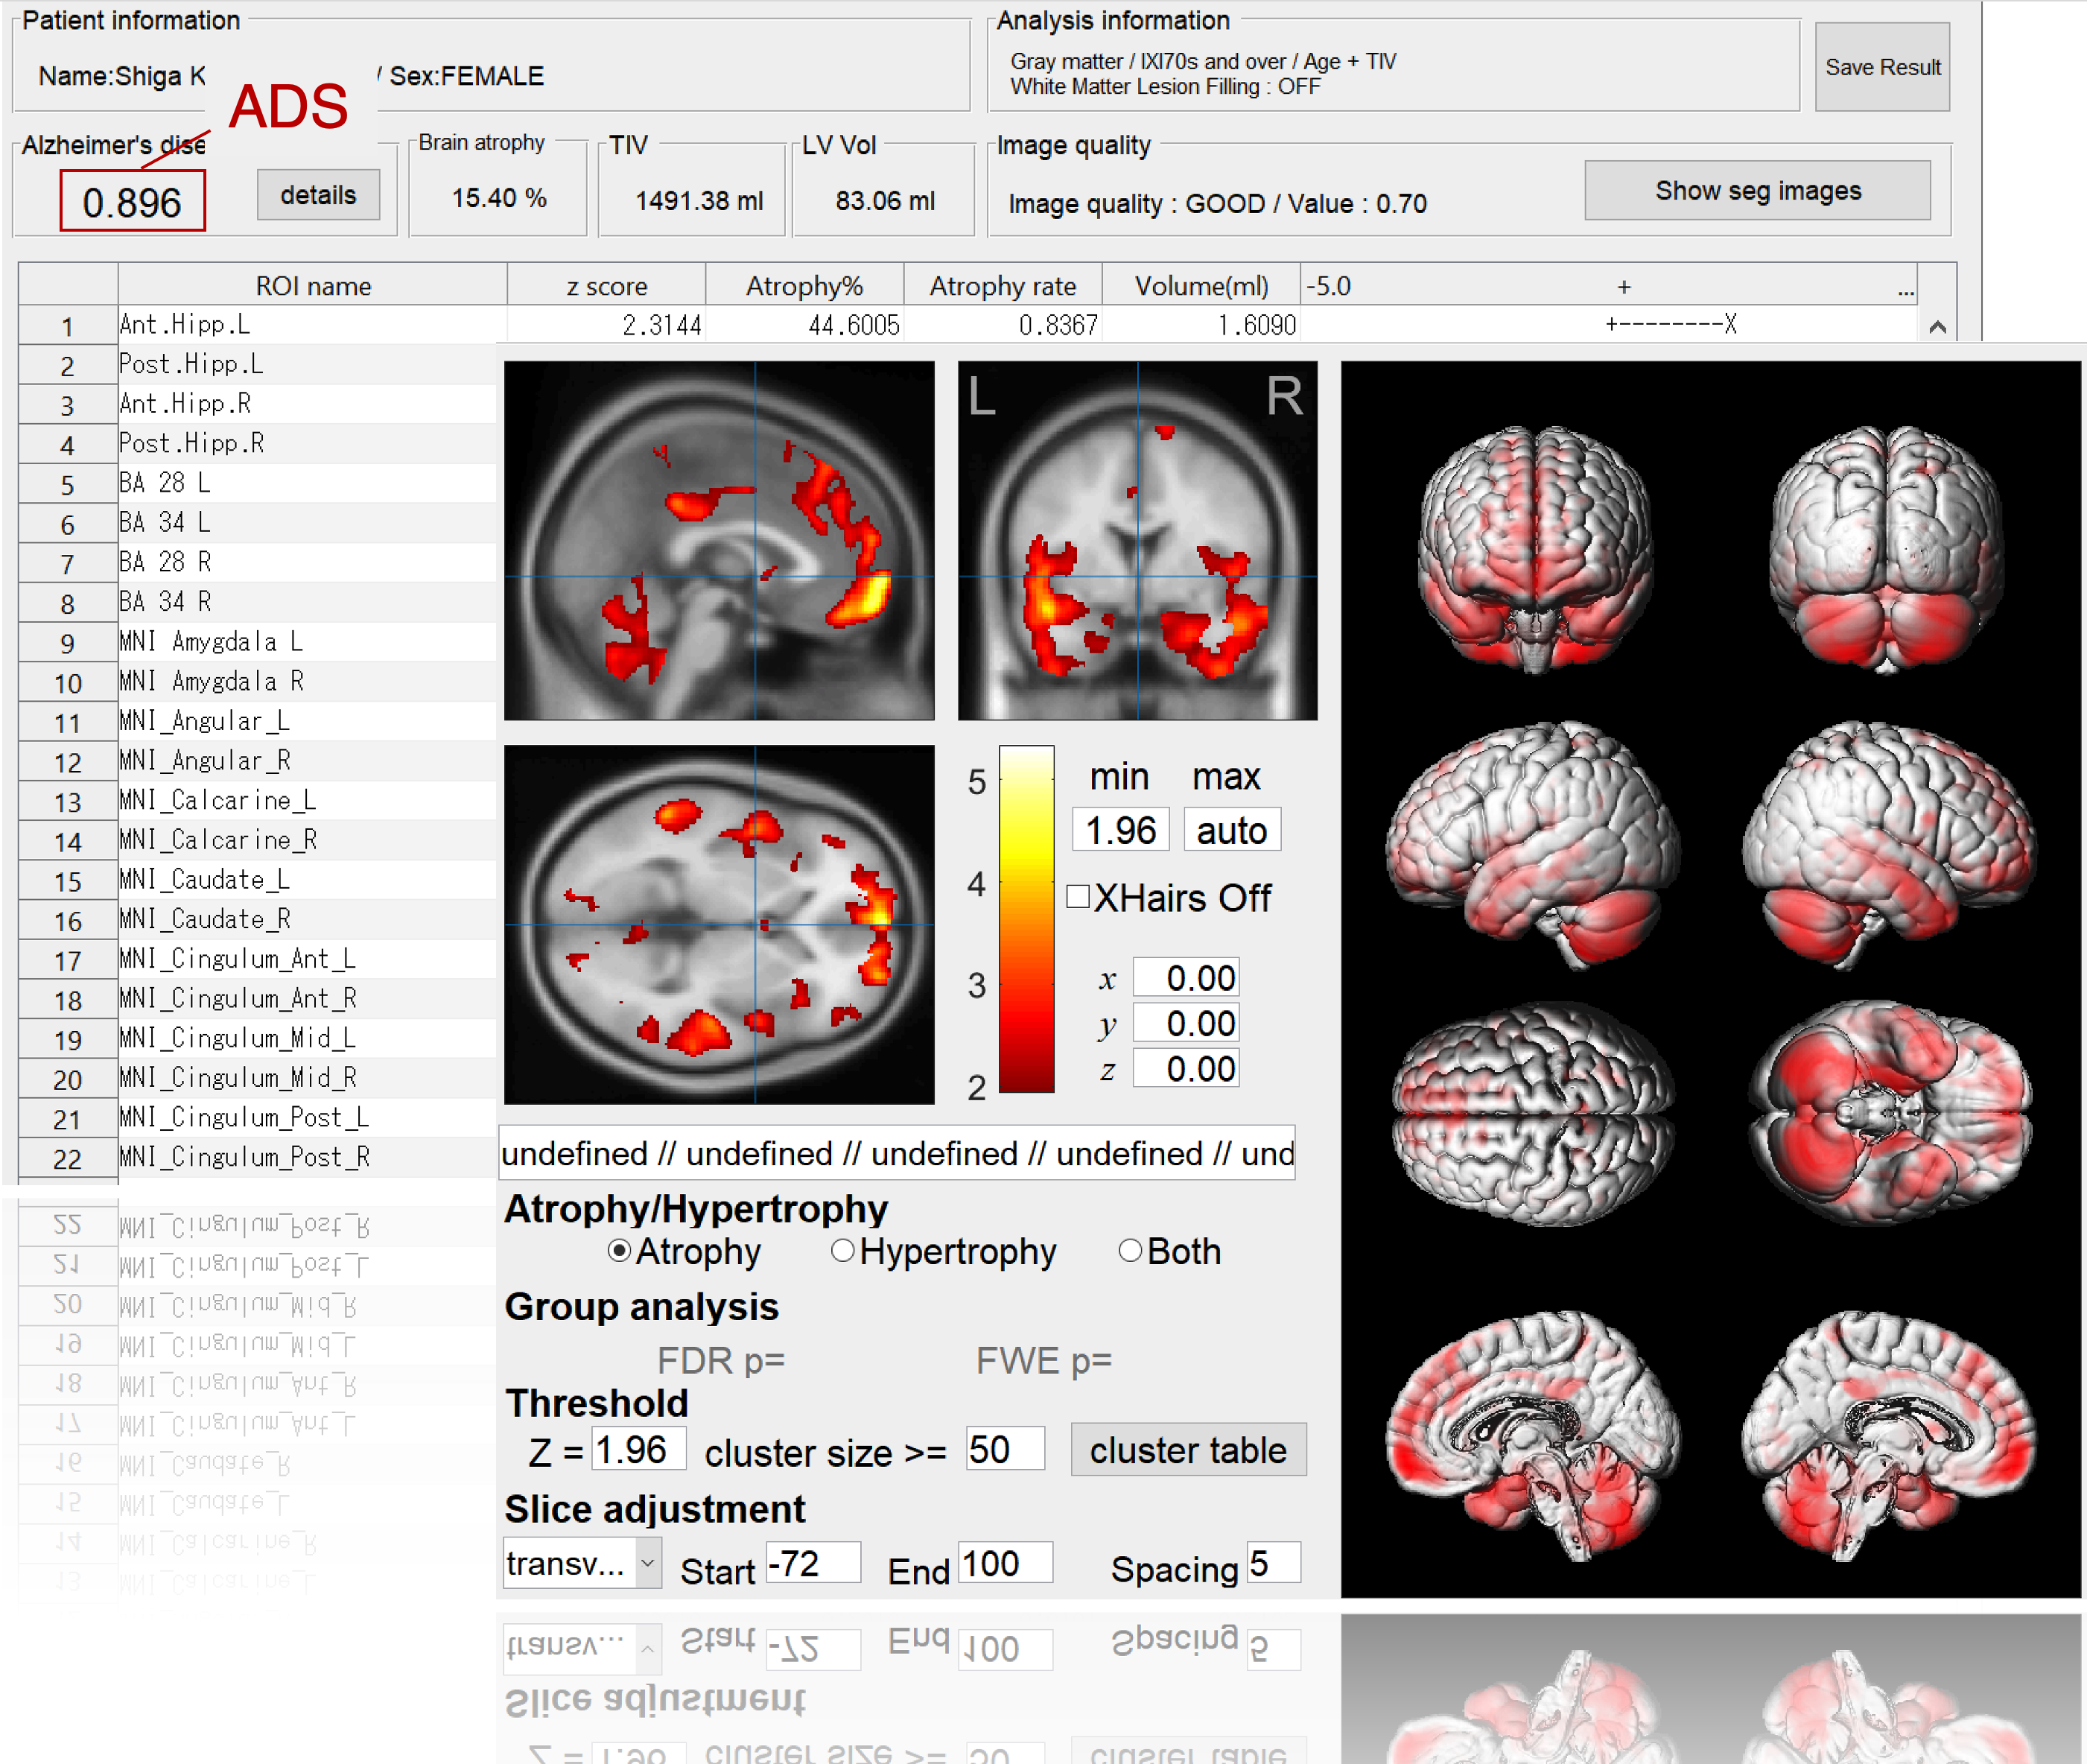
Alzheimer's disease (AD) can be conceptualized as a biological and clinical continuum from the preclinical phase (clinically asymptomatic subjects with AD pathology) to the clinical phase. Therefore, we trained the BAAD-AI by labeling AD and progressive MCI as being in the AD spectrum, and cognitively normal and stable MCI as being in the non-AD spectrum. The AI processes hundreds of information related to the structure of the brain, and presents a possibility of AD by a value from 0 to 1as Alzheimer's score (ADS). An ADS > 0.5 suggests the possibility of AD spectrum.
BAAD-AI outperformed radiologists for AD diagnosis in a structural magnetic resonance imaging review. (See references)
BAAD supports AD diagnosis
BAAD-AI outperformed radiologists for AD diagnosis in a structural magnetic resonance imaging review. The accuracy of the radiologists was 60-70%, respectively, whereas that of the BAAD-AI was 90%.
AI for Schizophrenia
AI for Schizophrenia
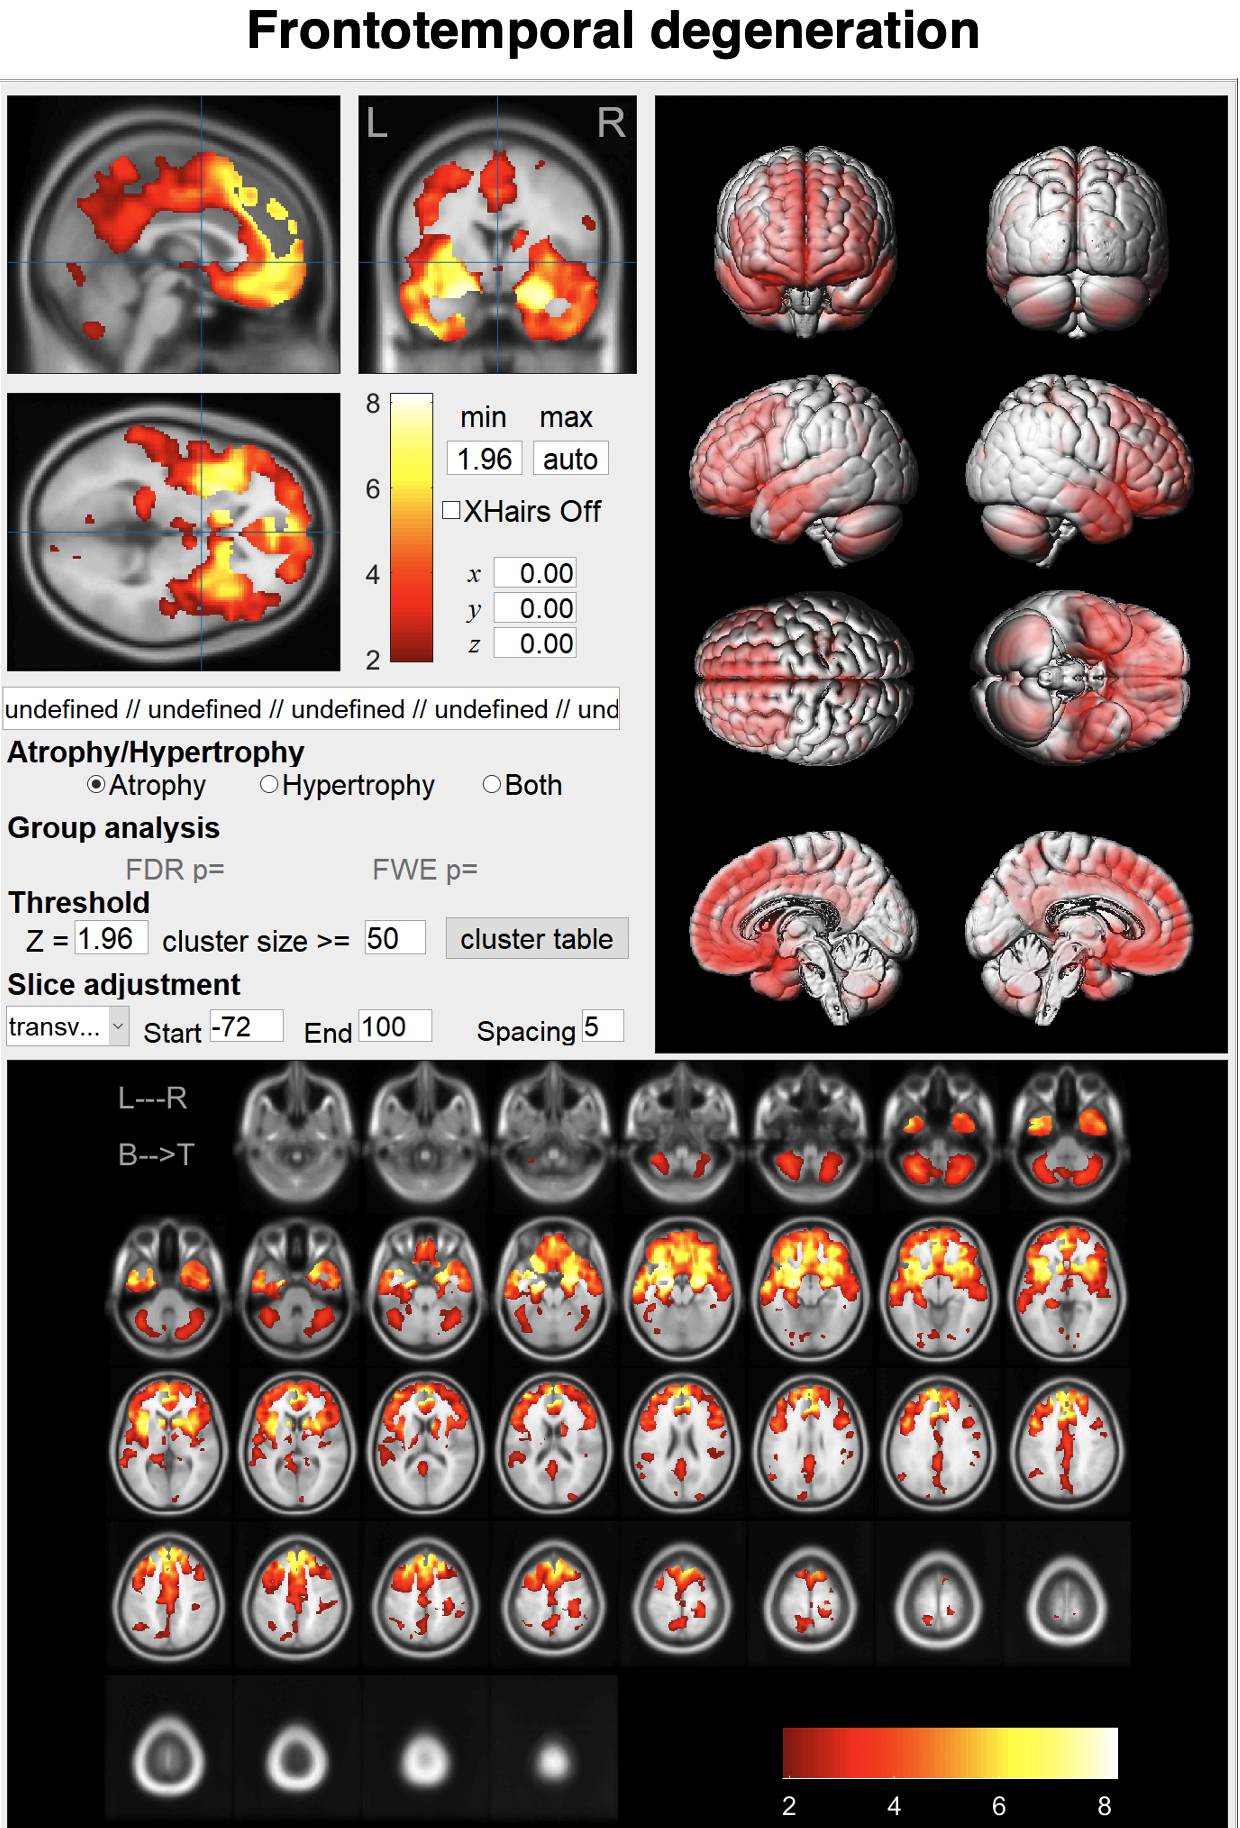
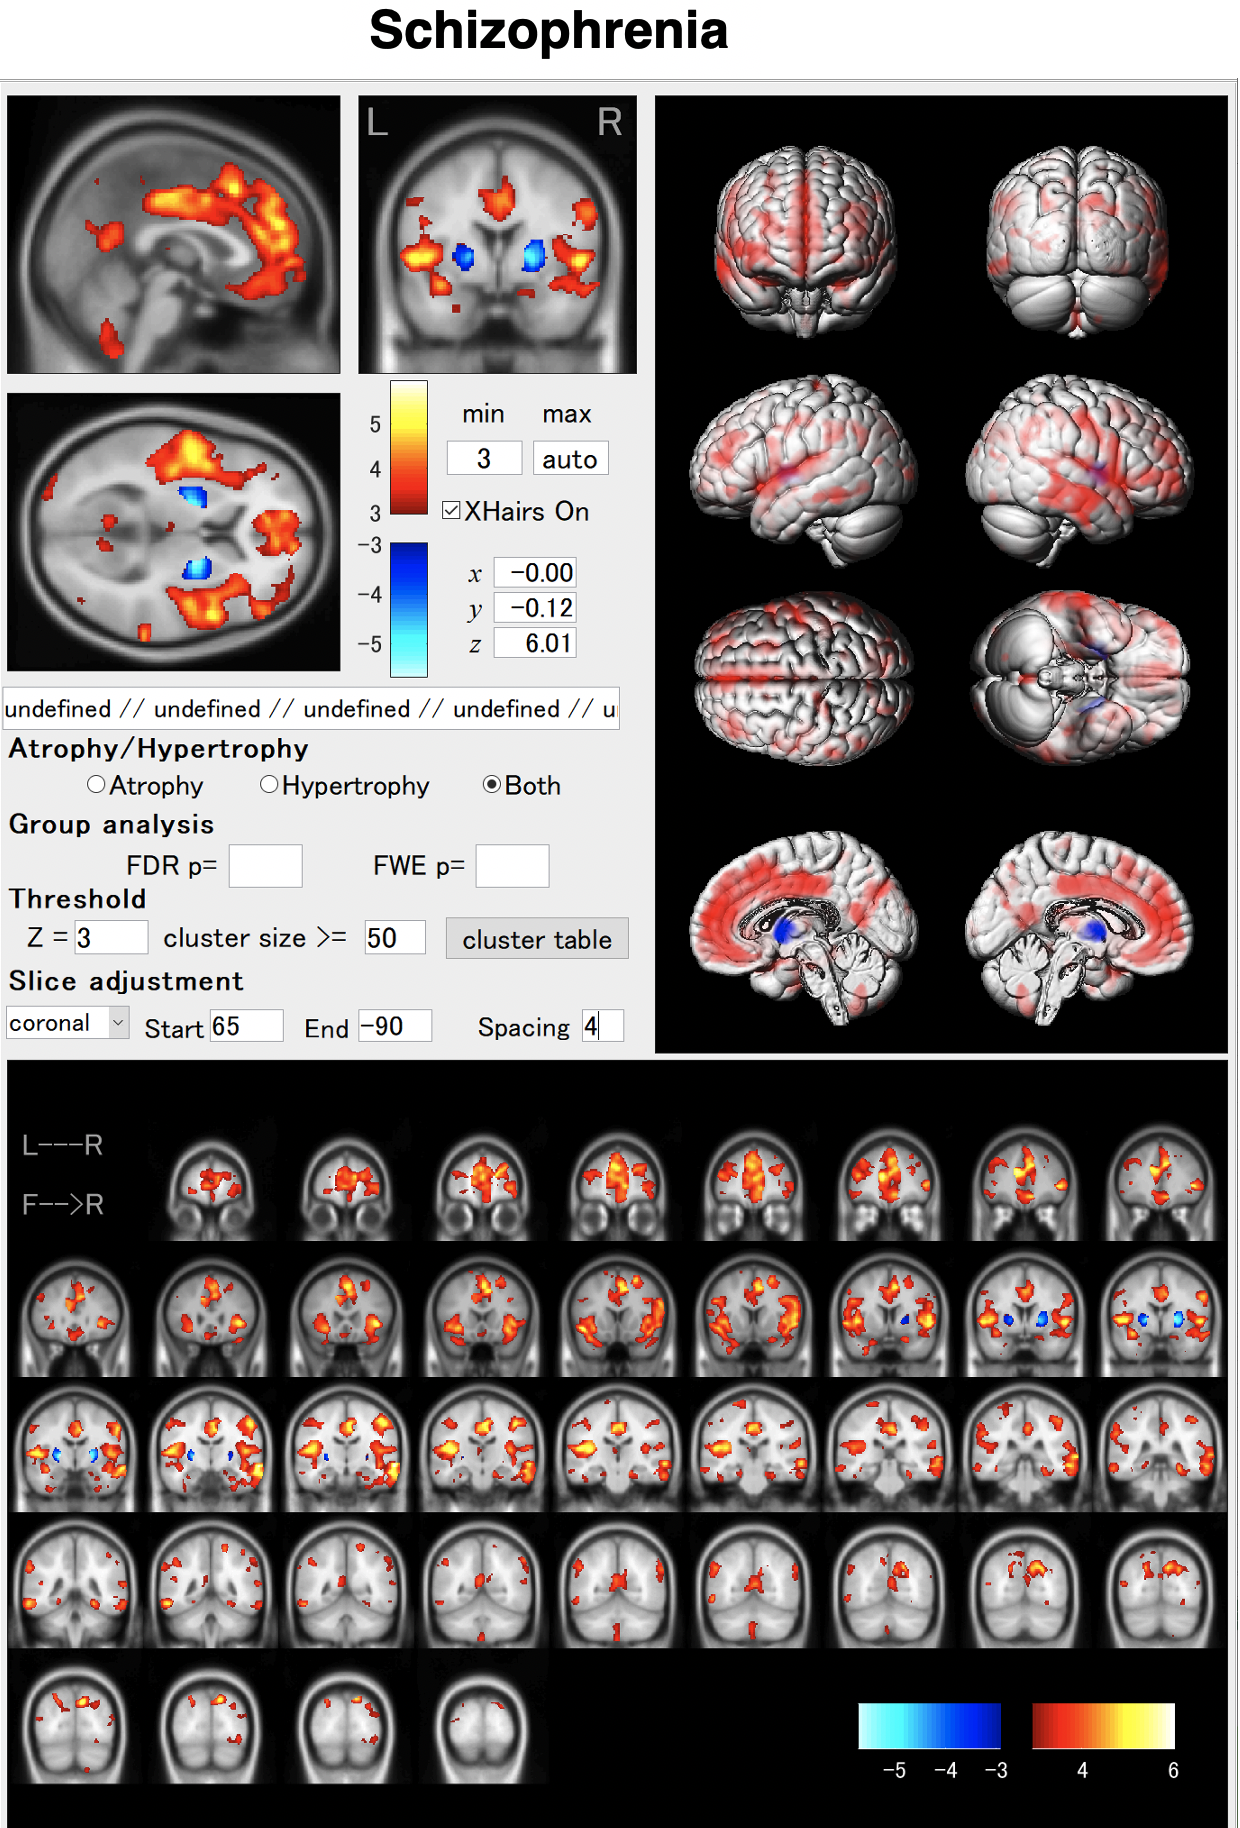
In schizophrenia, atrophy of the frontal lobes and insular gyrus appears. AI allows us to detect these features earlier. By using AI, it will be possible to capture these characteristics earlier. As shown in the VBM result, globus pallidus may hypertrophied in some cases.
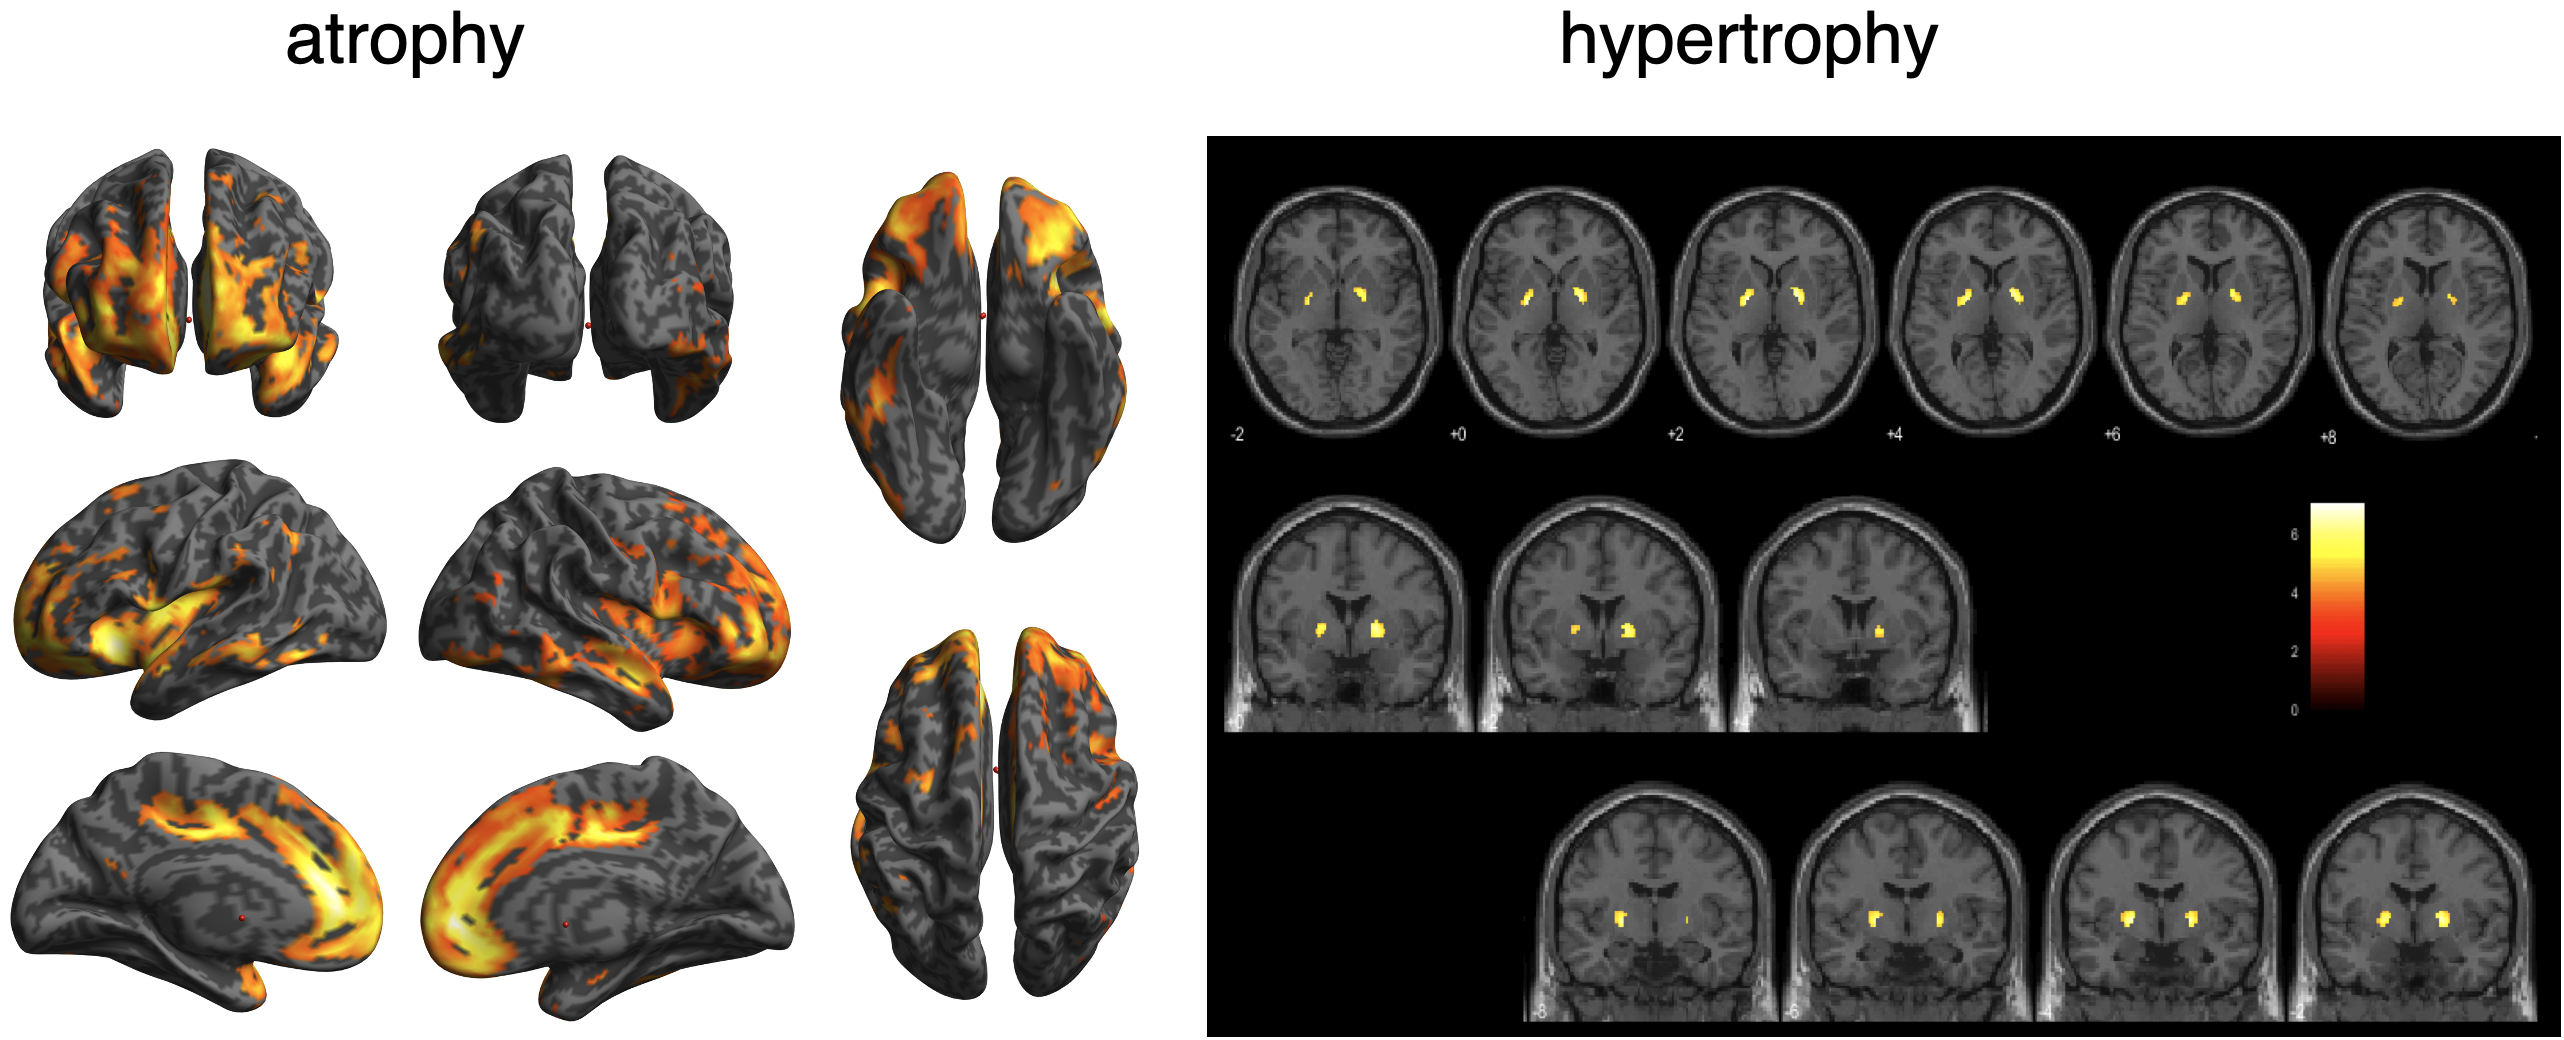
BAAD helps early detection of schizophrenia.
Full-automatic VBM analysis
Full-automatic VBM analysis
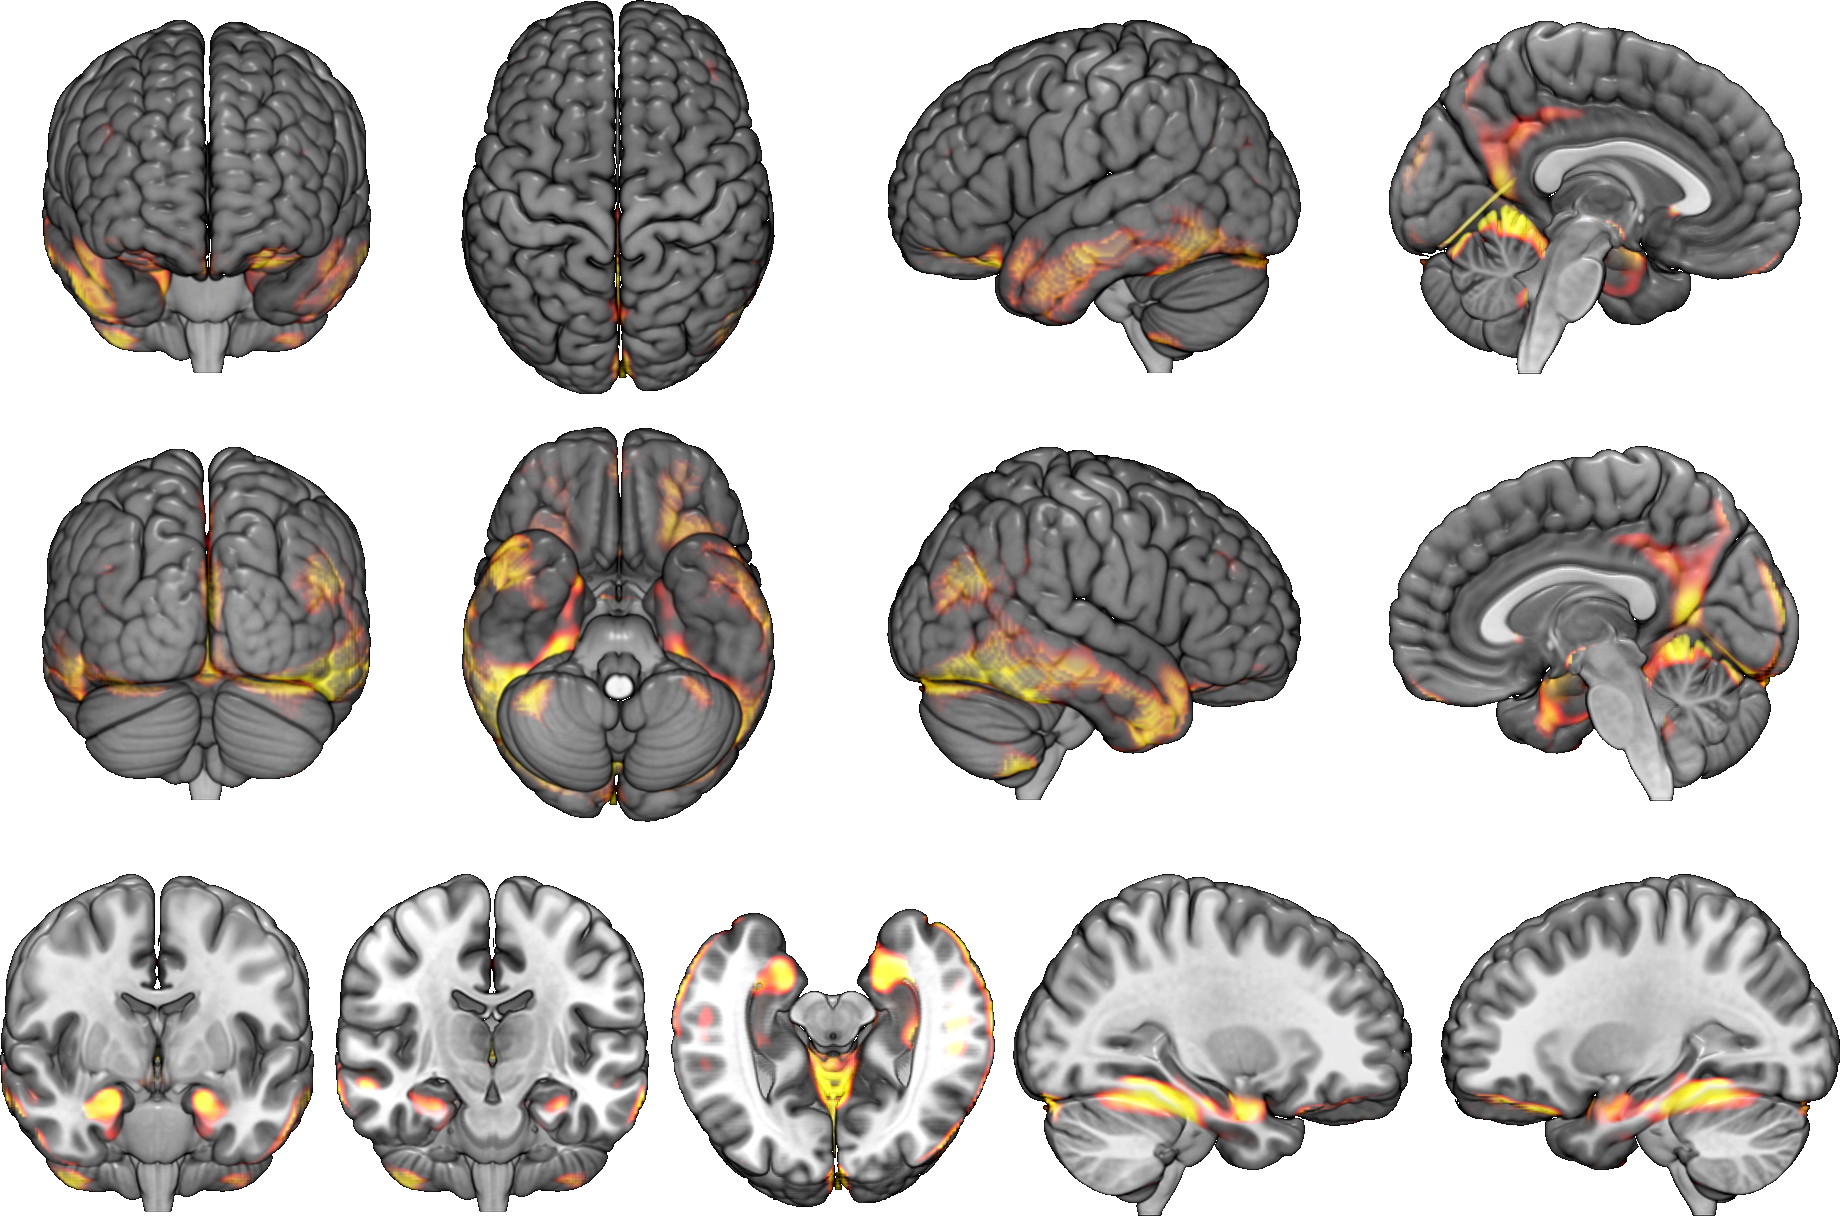
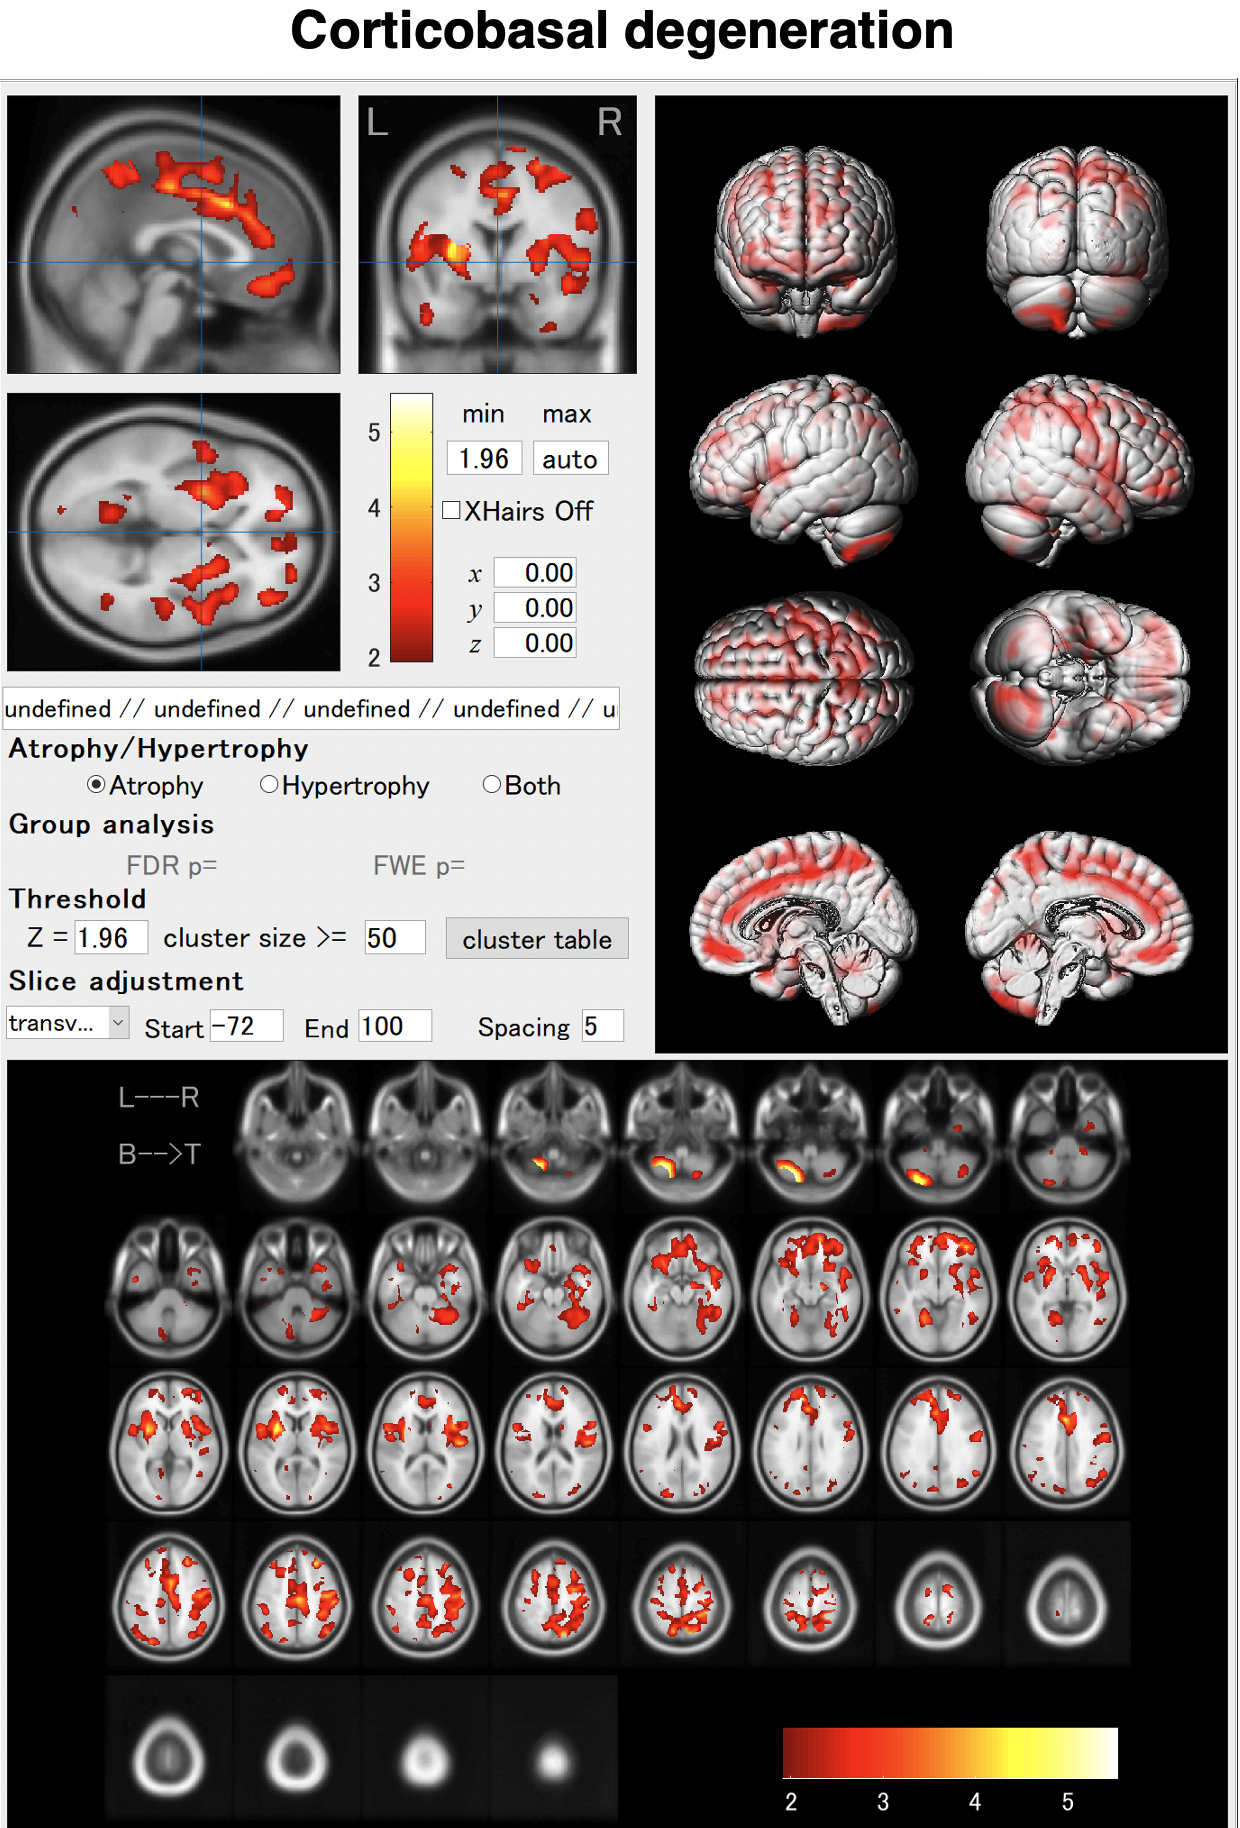
All it takes is one-click.
Just enter a MR image and click the "Analyze" button.You can see brain atrophy and hypertrophy in three dimensions.
MR images were preprocessed by VBM to standardize and simplify the features. Specifically, this included ensuring a unified brain shape, converting the volume into signal intensity, and adjusting the brain volume according to total intracranial volume (TIV) and age.
Structural parcellations such as the AAL, LPBA, and Brodmann area were adopted. These atlases were expected to reflect the unit of the neuronal network to some extent. Using multiple atlases facilitates optimal weight distribution of features during machine learning, supposedly compensating for the discrepancy between anatomical and pathology-specific boundaries.

All it takes is one-click.
Just enter a MR image and click the "Analyze" button.You can see brain atrophy and hypertrophy in three dimensions.
BAAD server system for hospital use
BAAD server system for hospital use
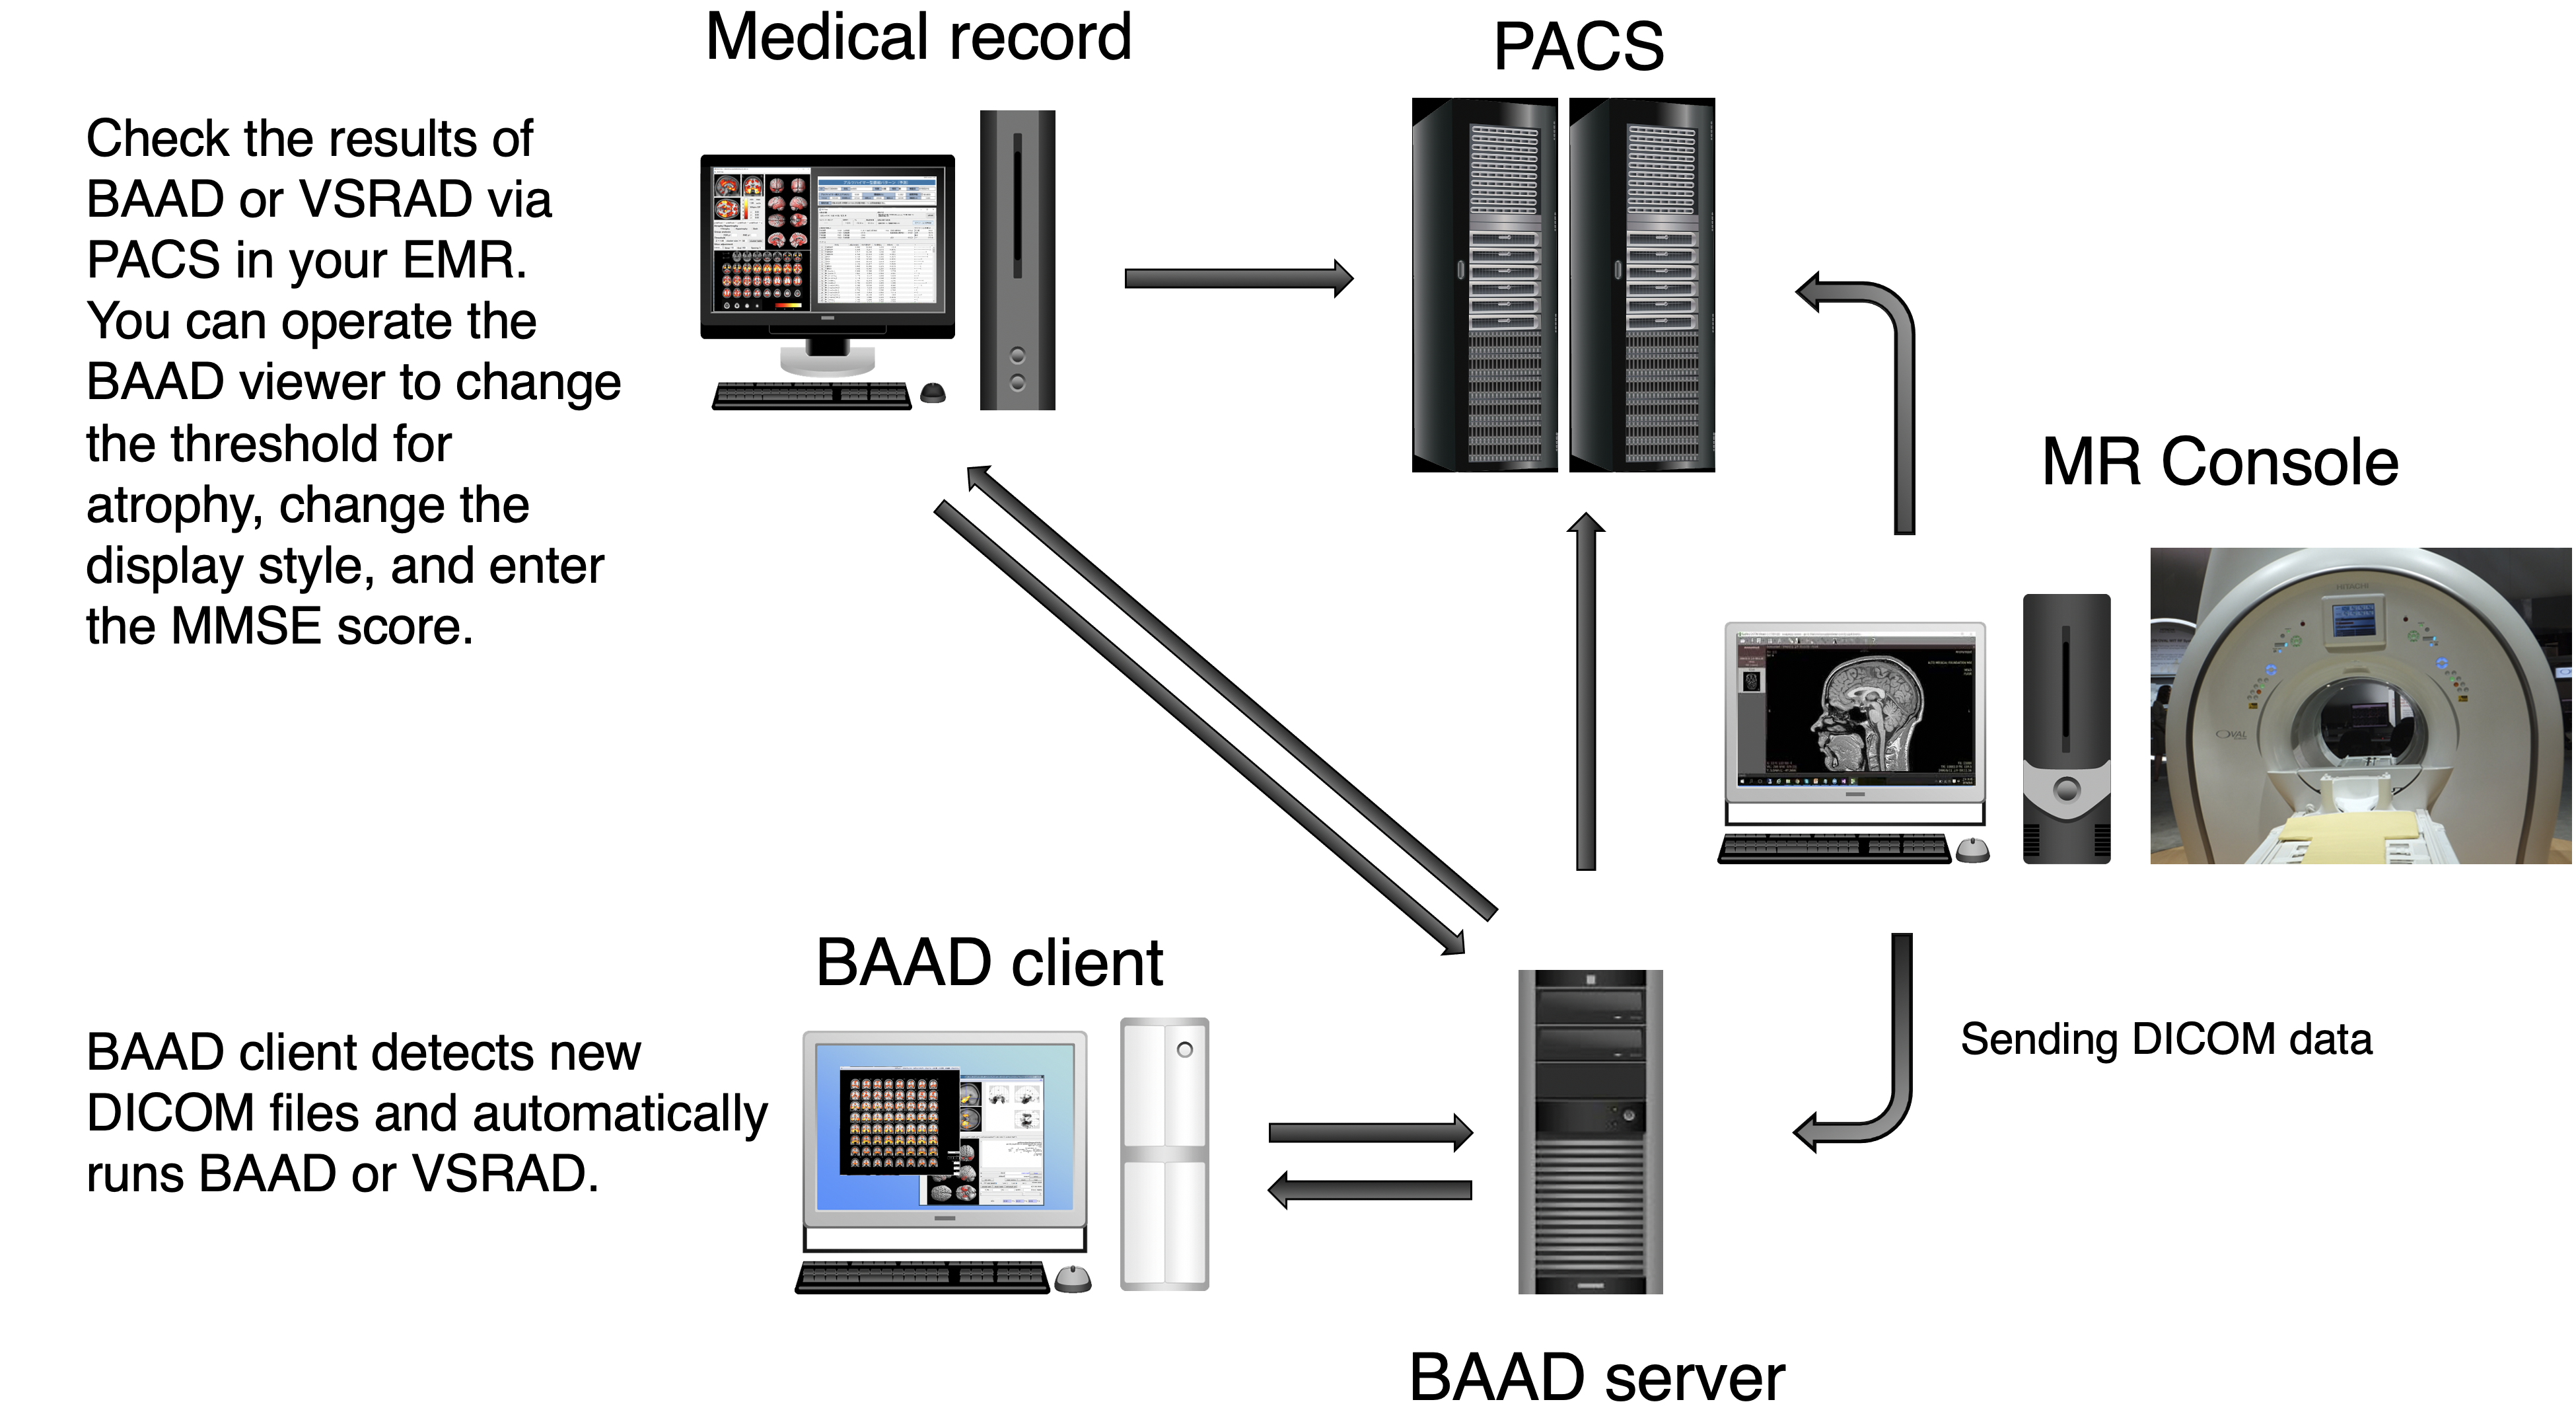
We recommend installing BAAD server system in your clinic. With BAAD server, you can manage all BAAD-related data. The BAAD Client monitors the BAAD server, and when it detects new DICOM files, it automatically starts analysis and sends the results back to PACS via BAAD server. This automated system can also be adapted to other applications such as VSRAD. Therefore, physicians can check the results of BAAD and/or VSRAD together with MR images on their electric medical record through PACS.
With the BAAD viewer, further analysis can be performed on a PC equipped with an electronic medical record. In addition, by inputting MMSE score into the BAAD viewer, BAAD-AI will display advanced results based on the brain MRI results. The results of the analysis are stored and managed on the BAAD server, allowing for long-term analysis.
Synchronize with your PACS
The BAAD server system frees you from the tedious task of reporting the results. If you would like to install the system, please feel free to contact us (if you provide your own PC, the installation cost will be very little). In addition, you can manage the time series of each patients and enter MMSE scores from an outpatient PC.


We recommend installing BAAD server system in your clinic. With BAAD server, you can manage all BAAD-related data. The BAAD Client monitors the BAAD server, and when it detects new DICOM files, it automatically starts analysis and sends the results back to PACS via BAAD server. This automated system can also be adapted to other applications such as VSRAD. Therefore, physicians can check the results of BAAD and/or VSRAD together with MR images on their electric medical record through PACS.
With the BAAD viewer, further analysis can be performed on a PC equipped with an electronic medical record. In addition, by inputting MMSE score into the BAAD viewer, BAAD-AI will display advanced results based on the brain MRI results. The results of the analysis are stored and managed on the BAAD server, allowing for long-term analysis.

Synchronize with your PACS
The BAAD server system frees you from the tedious task of reporting the results. If you would like to install the system, please feel free to contact us (if you provide your own PC, the installation cost will be very little). In addition, you can manage the time series of each patients and enter MMSE scores from an outpatient PC.


BAAD extensions
BAAD extensions
You can use SPM12 or CAT12 from BAAD. Permutation test and TFCE are available through these programs.
In addition to VBM, surface-based morphometry (SBM) and tensor-based morphometry (TBM) can be performed.
Measurement of the volumes of white matter lesions is available, they can be measured separately as periventricular and deep white matter lesions. For hydrocephalus, the volume of the lateral ventricles can also be measured.
The biological age of the brain can be estimated by applying machine learning to magnetic resonance imaging (MRI) data. BAAD will show a patient’s biological age using eXtreme Gradient Boosting (XGBoost). The gap between biological and chronological brain age may reflect past and ongoing neurobiological aging processes.


How to start?
How to start?
BAAD is easy to get started. After downloading, follow the instructions to install it. Double-click the BAAD icon to start, then a top panel will open. Please input the data to analyze, and click the “analyze” button. Then it runs fully automatically.
In order to input the data, you need to convert the DICOM files into NIfTI format. Since the conversion to NIfTI format anonymizes the personal information in the data, BAAD extracts the name, age, and gender information from the DICOM header and registers them in the NIfTI file. In this way, age and gender can be used as covariates in VBM analysis.
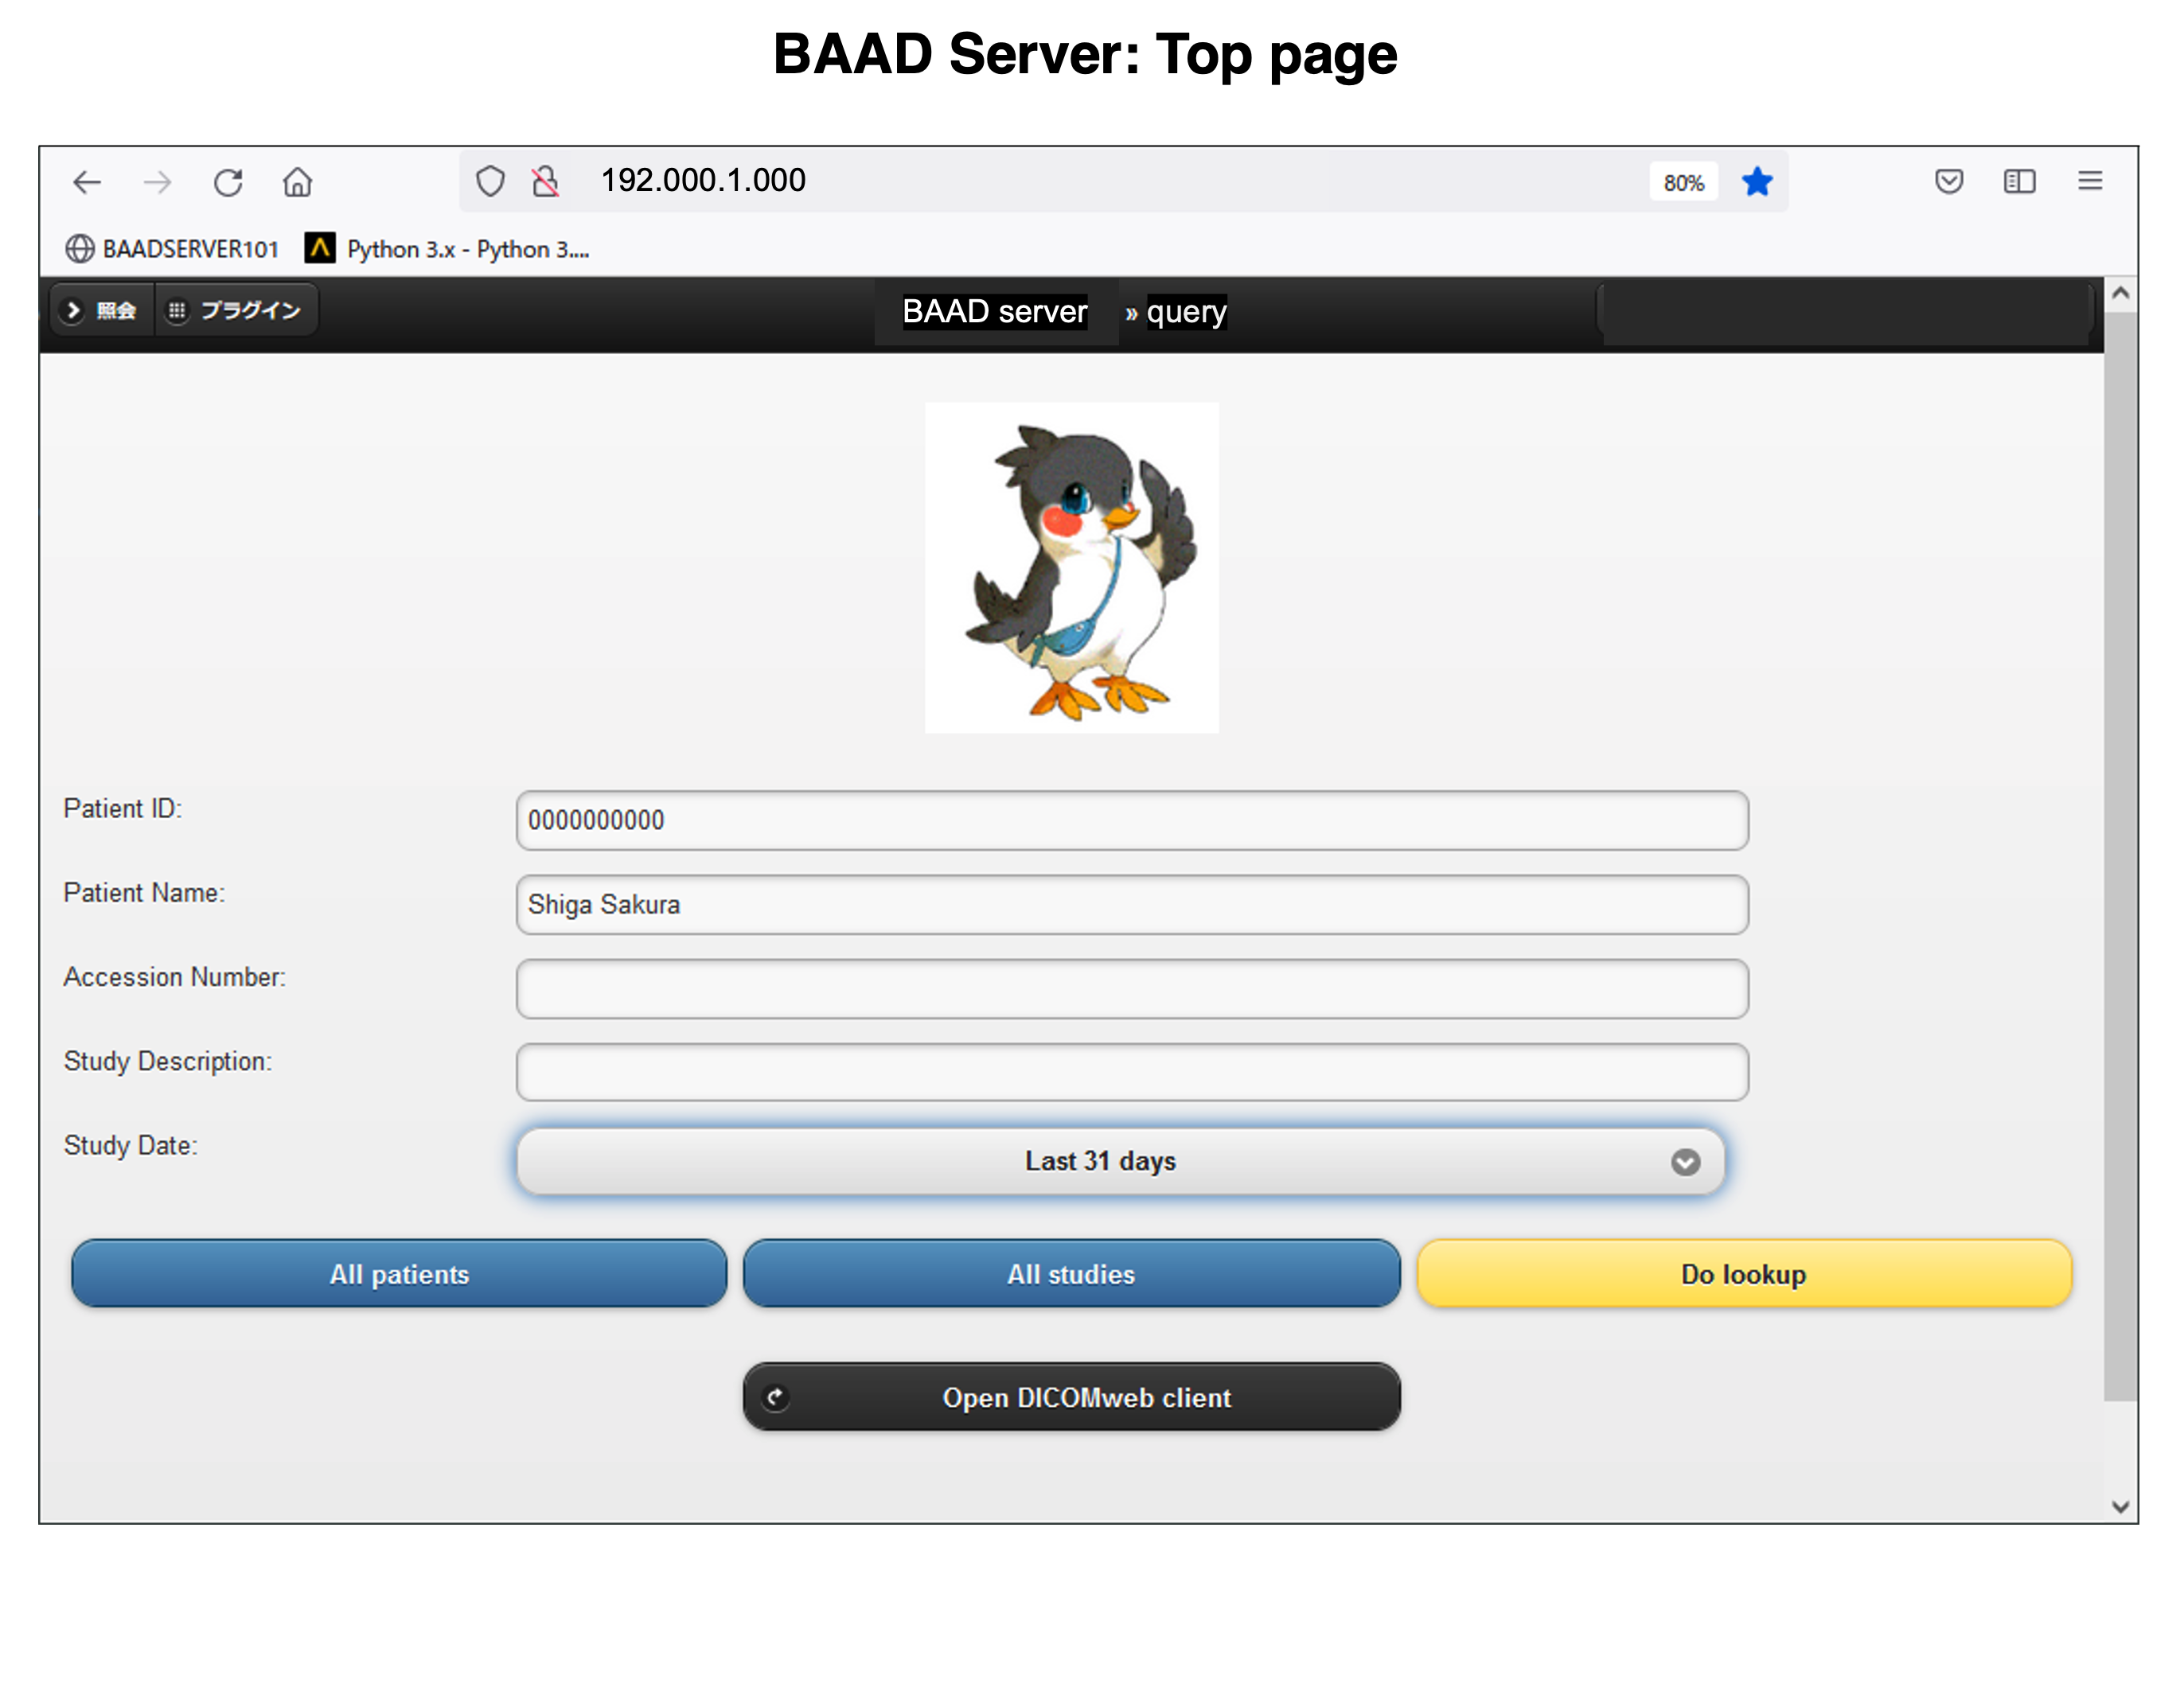
BAAD Top panel
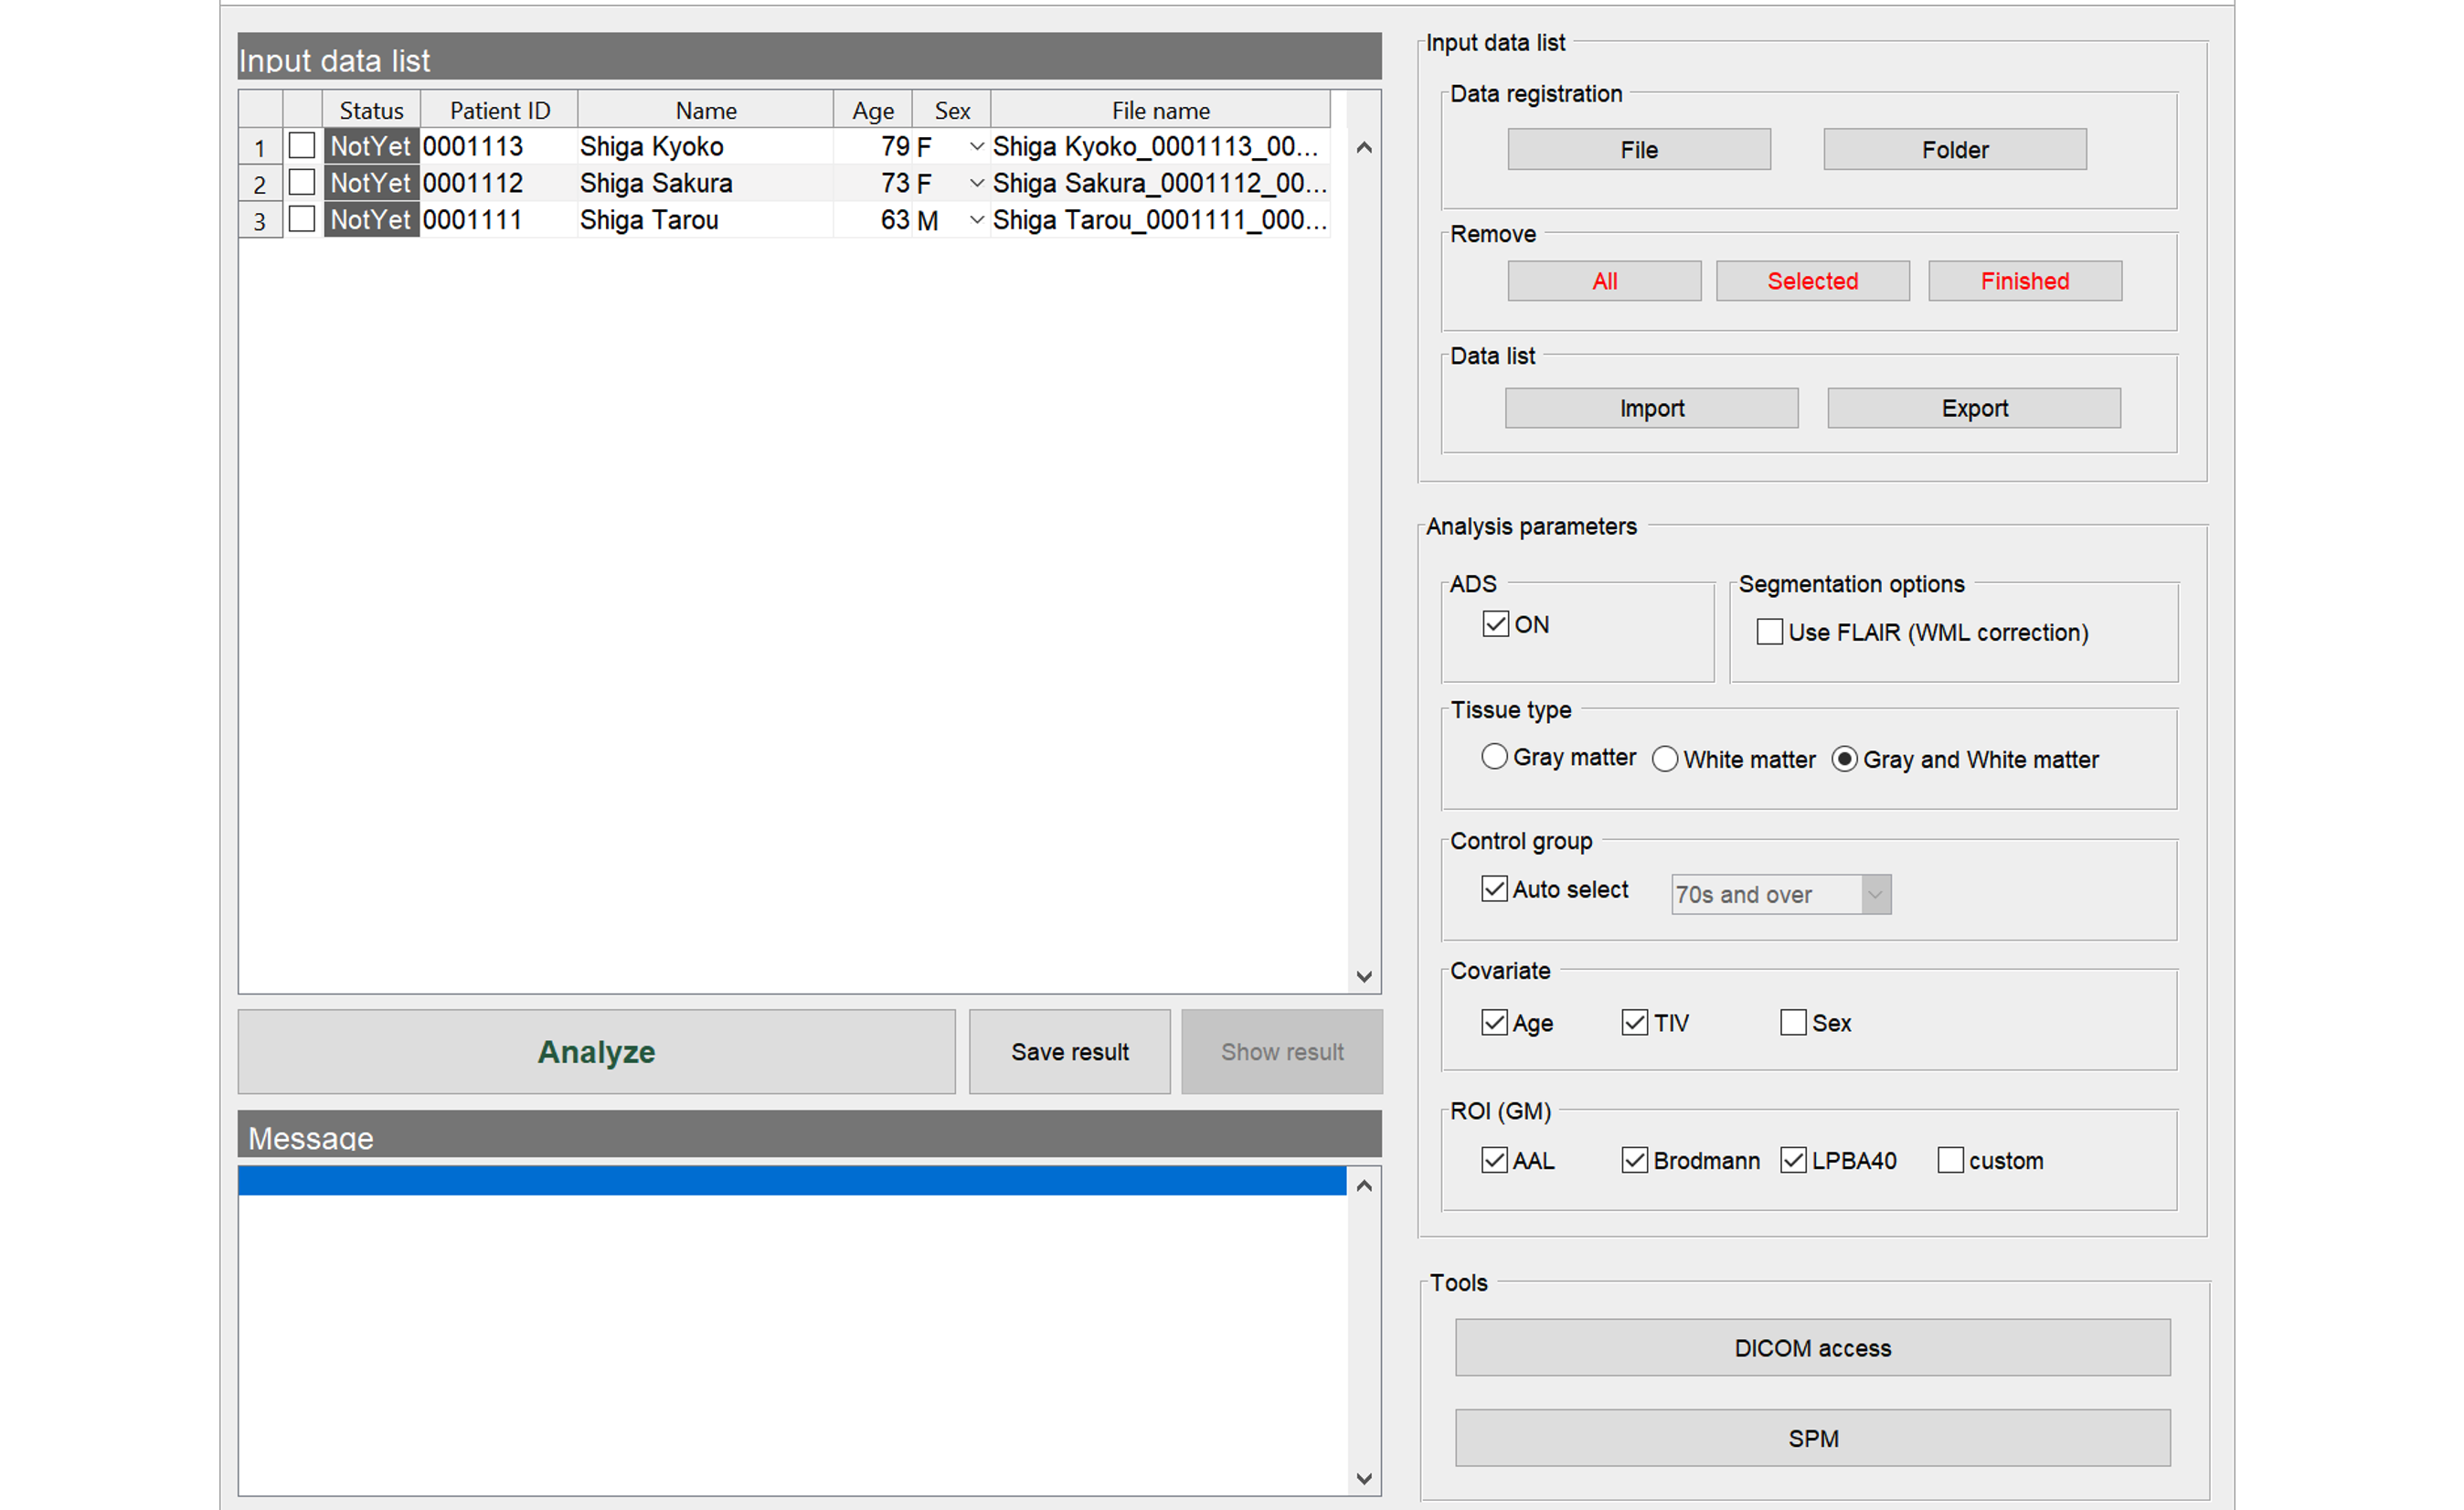
Import the files to analyze. The data must be in NIfTI format. In case of DICOM files, you need to convert it to NIfTI format as described below.
BAAD is easy to get started. After downloading, follow the instructions to install it. Double-click the BAAD icon to start, then a top panel will open. Please input the data to analyze, and click the “analyze” button. Then it runs fully automatically.
BAAD Top panel

Import the files to analyze. The data must be in NIfTI format. In case of DICOM files, you need to convert it to NIfTI format as described below.
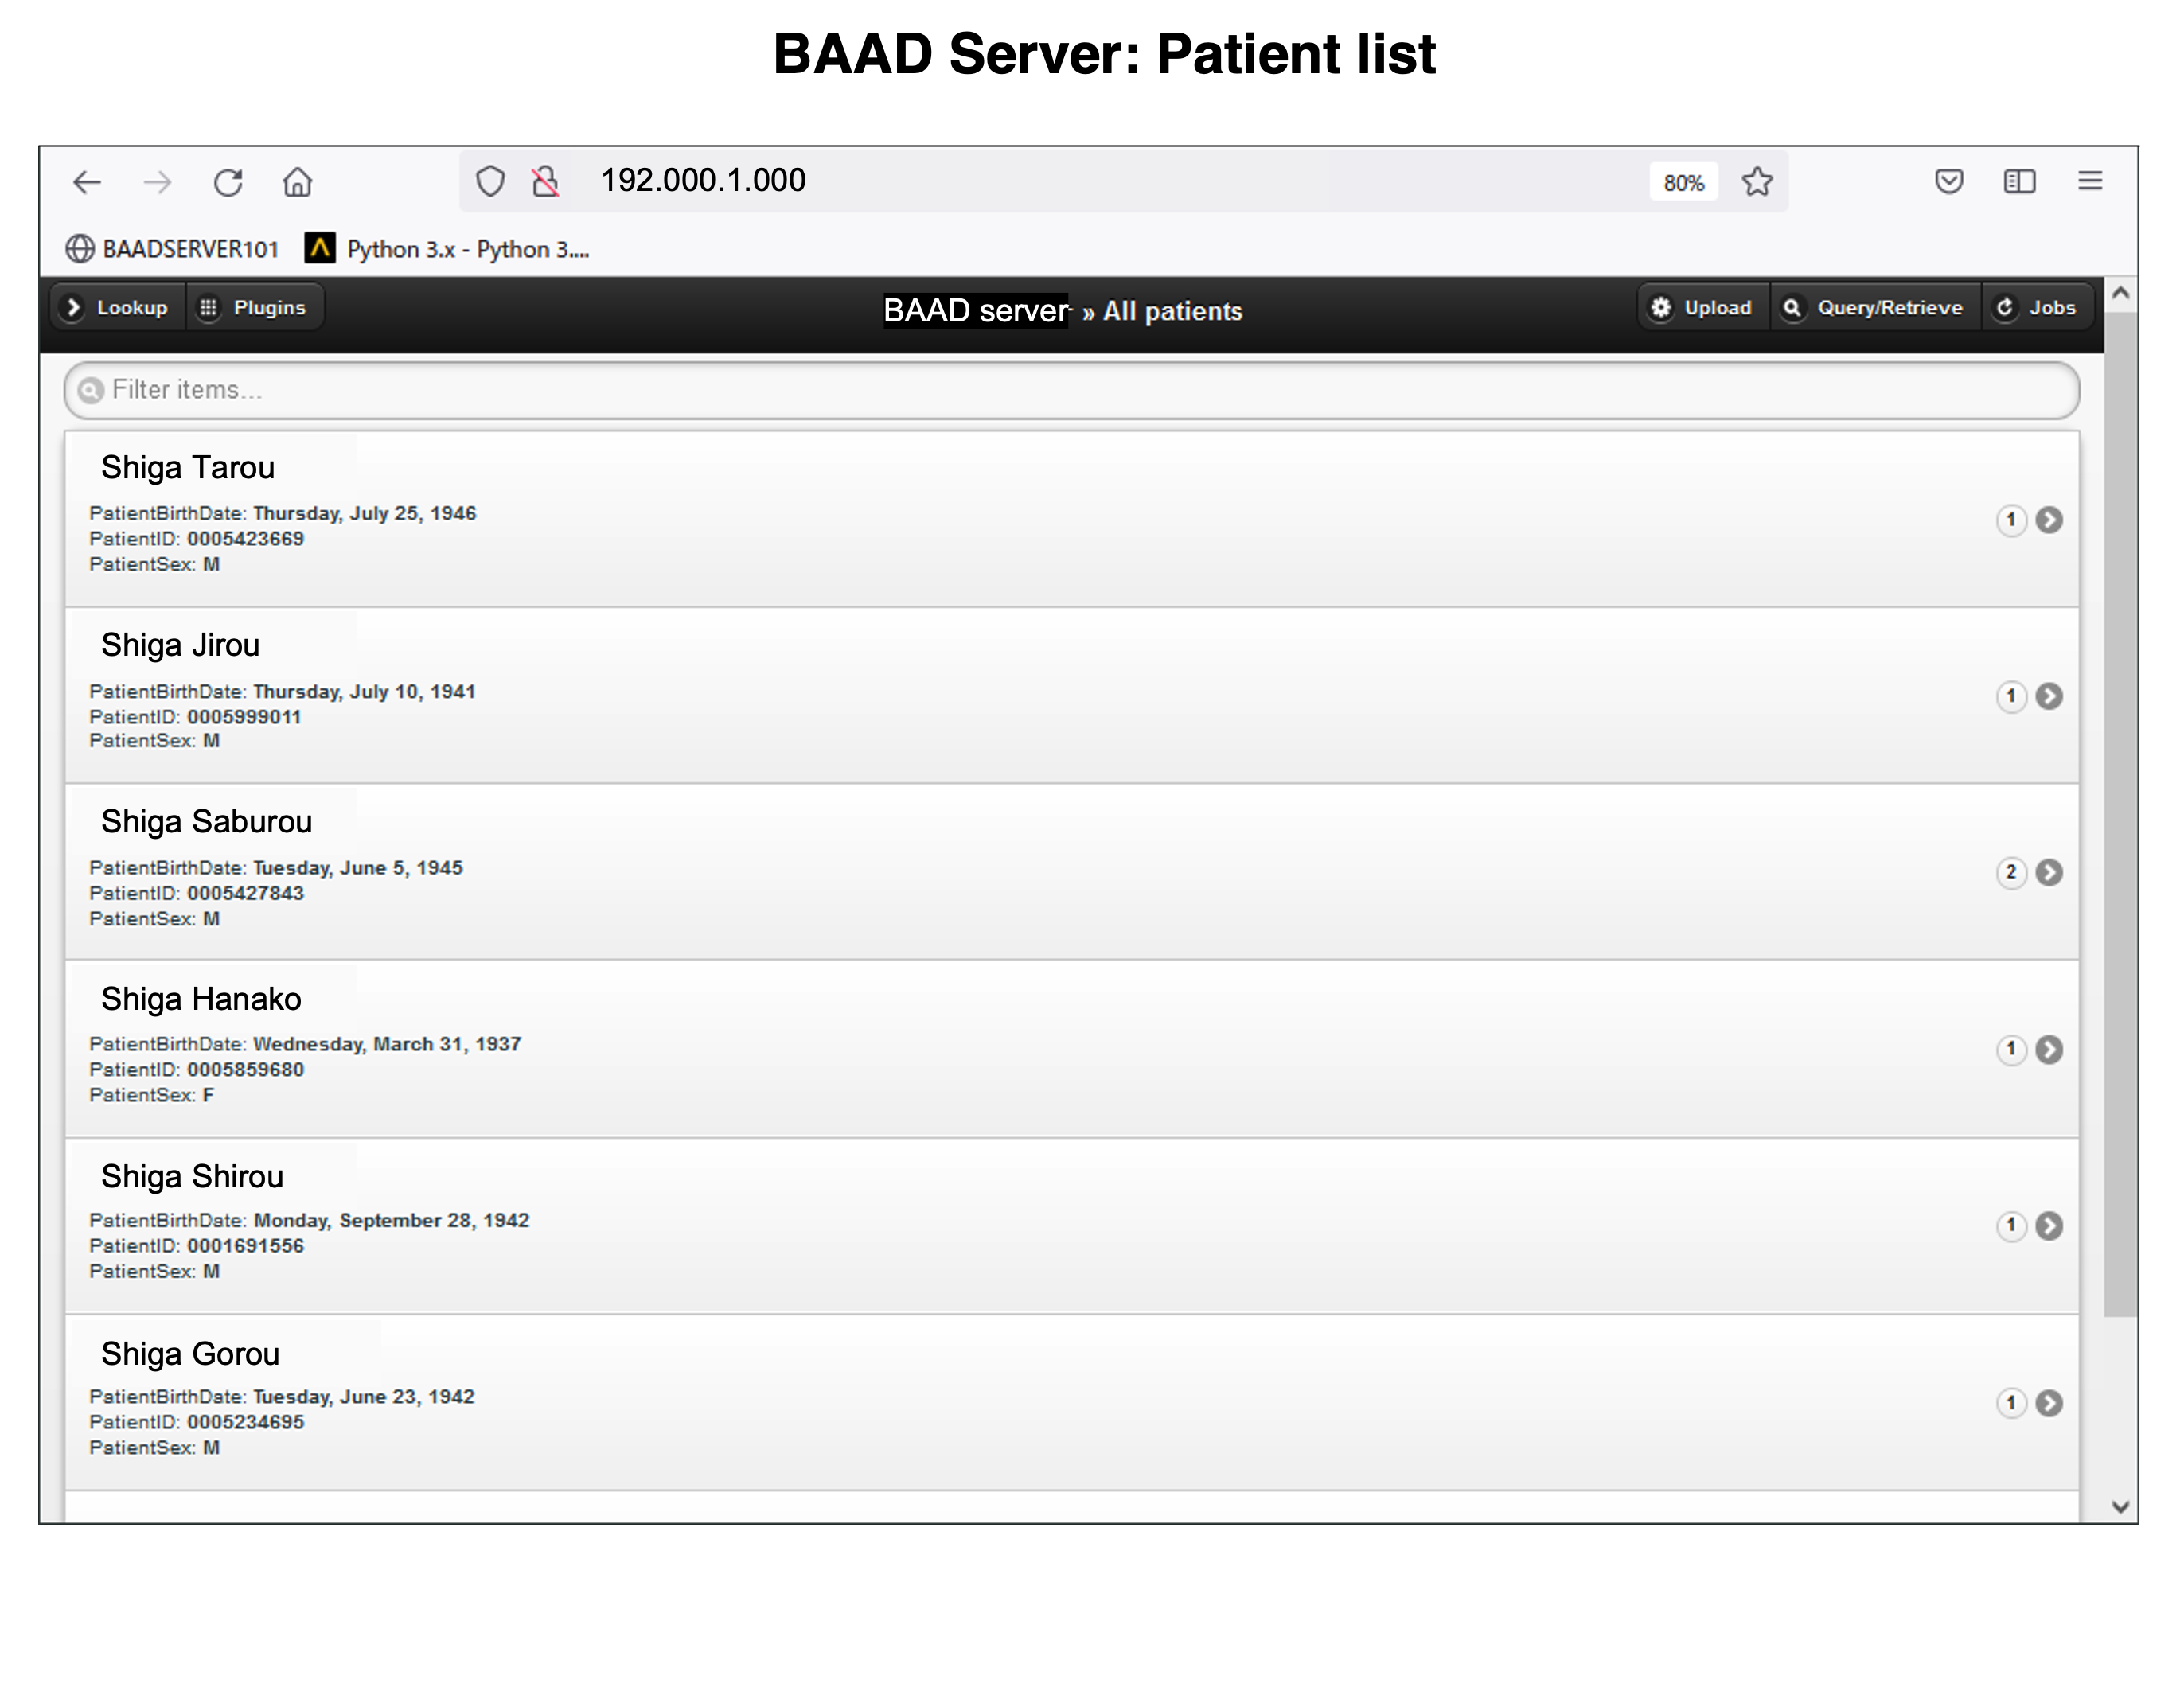
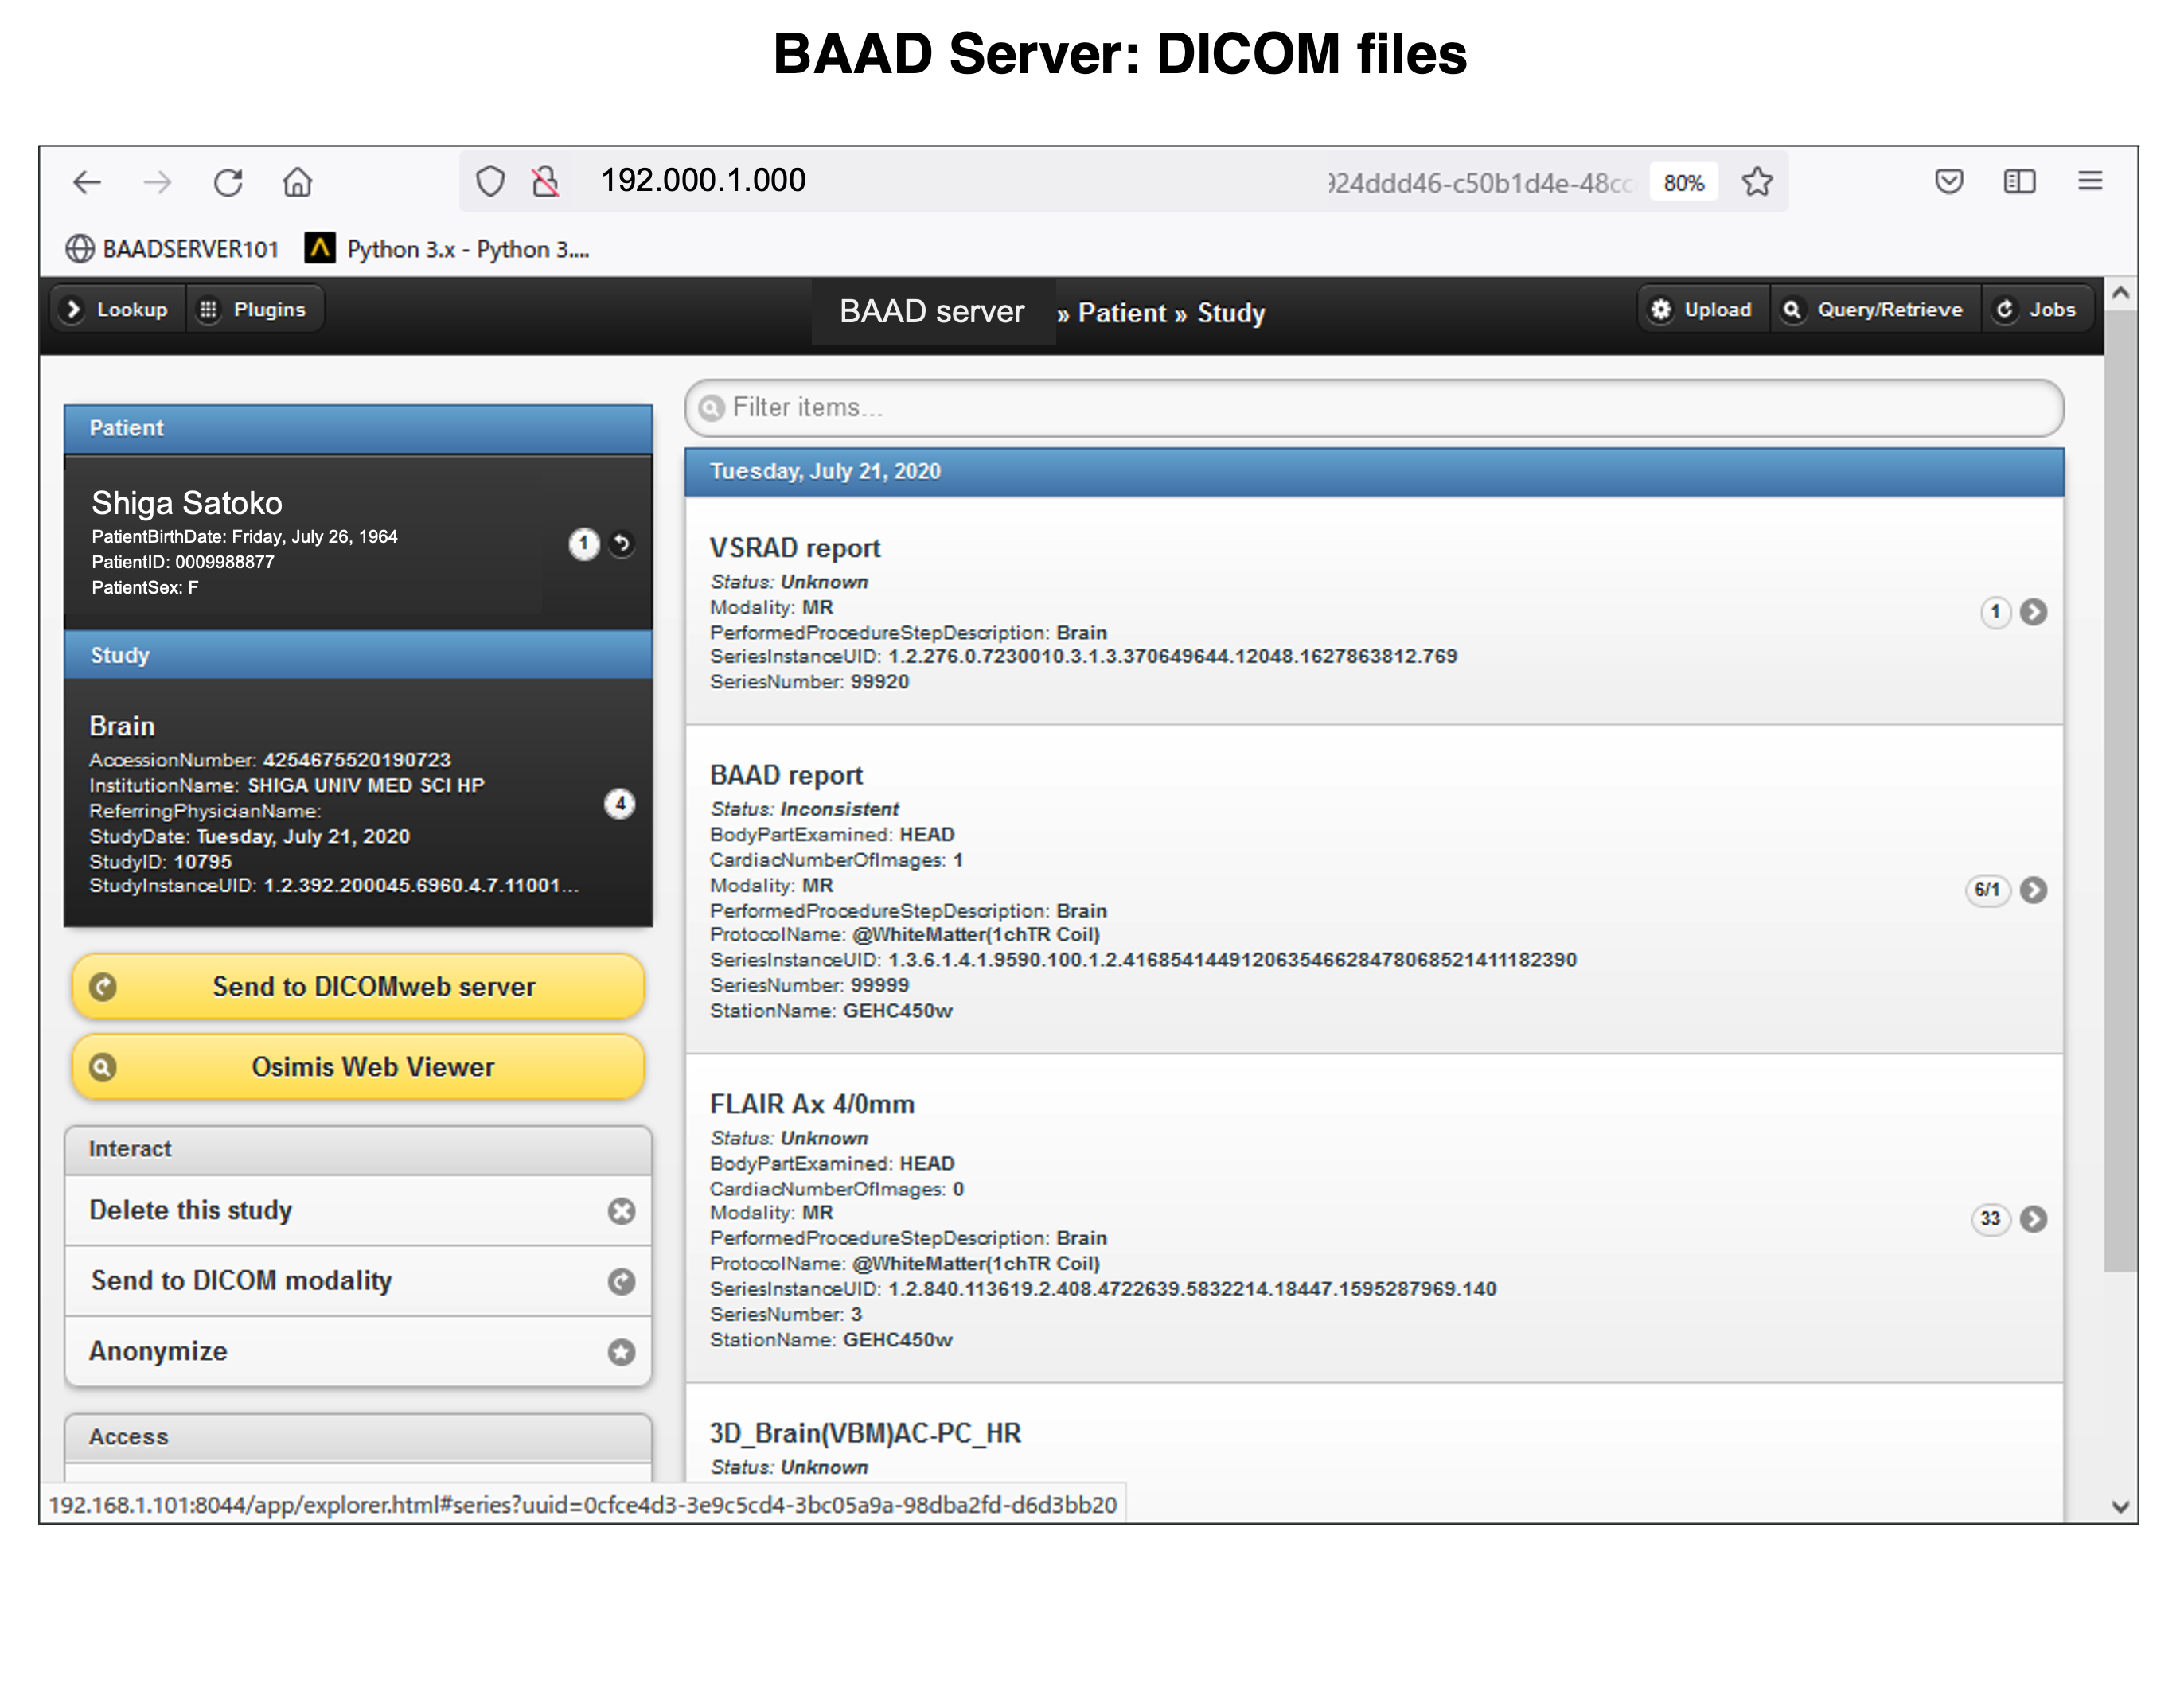
DICOM to NIfTI conversion

There are four ways to specify the DICOM files to be converted. Specify DICOM files one image at a time, specify them as a single folder, specify multiple folders at once, or specify them while checking the images. The last method allows you to change the file name of the NIfTI format (3DT1, FLAIR), which is required by BAAD for automatic recognition.
Besides sent directly from the MR console, DICOM files are often transferred via CD. BAAD provides four methods for conversion to accommodate a variety of DICOM media.
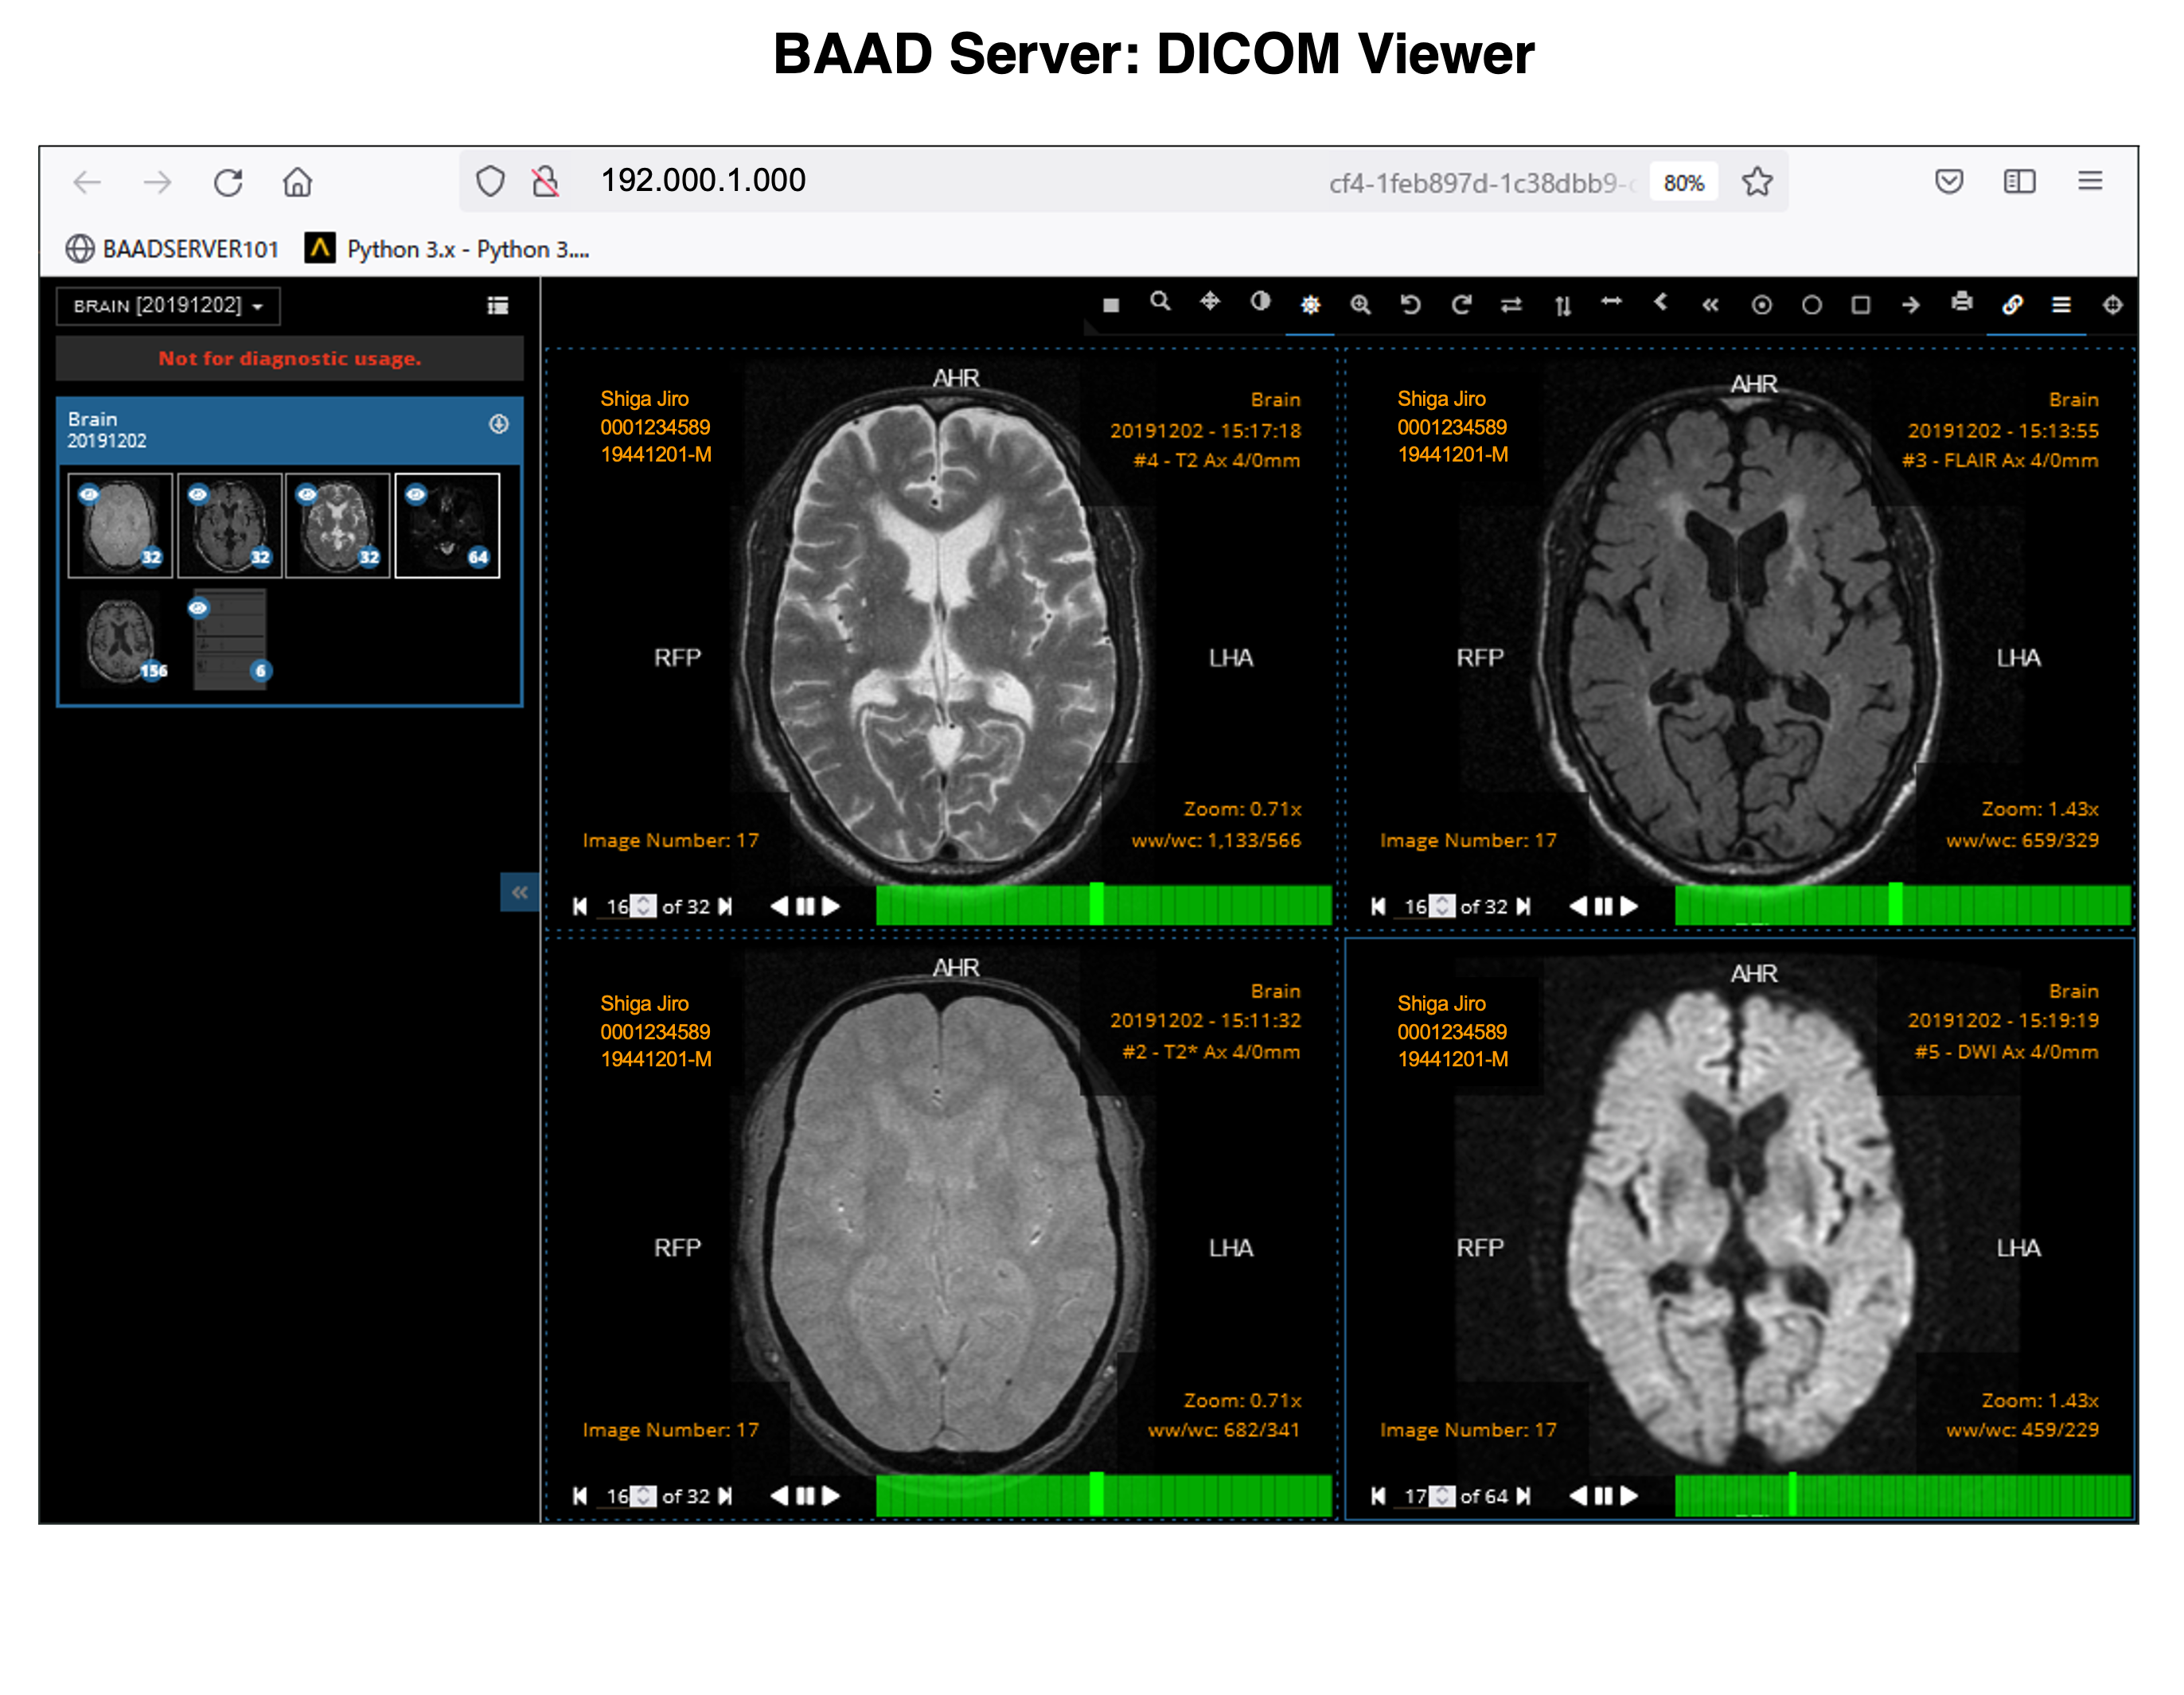
Check DICOM images

Multiple DICOM series will be presented as images. You can check 3DT1WI, FLAIR, T2WI, MRA, etc. and correct here if different.
Start to analyze

Specify The Analysis Settings. Here You Can Specify The Type Of Ai, Gray/White Matter Settings, Covariates, Control Group, And Atlas To Be Used.
Show the results

Specify the case to display the results. You can check the regions of brain atrophy and/or hypertrophy. You can change the threshold value, slice direction, slice interval, etc. FWE-correction by RFT is also available for intergroup tests.
DICOM to NIfTI conversion
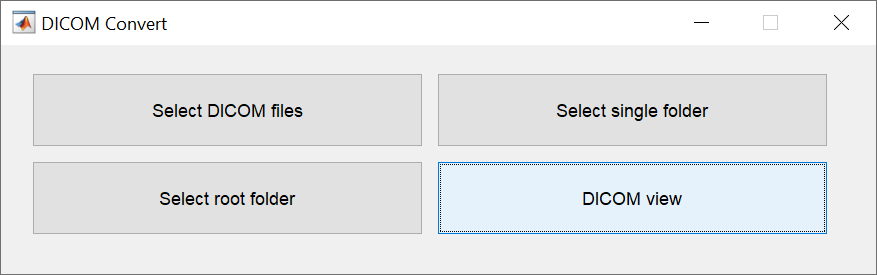
There are four ways to specify the DICOM files to be converted. Specify DICOM files one image at a time, specify them as a single folder, specify multiple folders at once, or specify them while checking the images. The last method allows you to change the file name of the NIfTI format (3DT1, FLAIR), which is required by BAAD for automatic recognition.
Besides sent directly from the MR console, DICOM files are ofen transferred via CD. BAAD provides four methods for conversion to accommodate a variety of DICOM media.
Check DICOM images
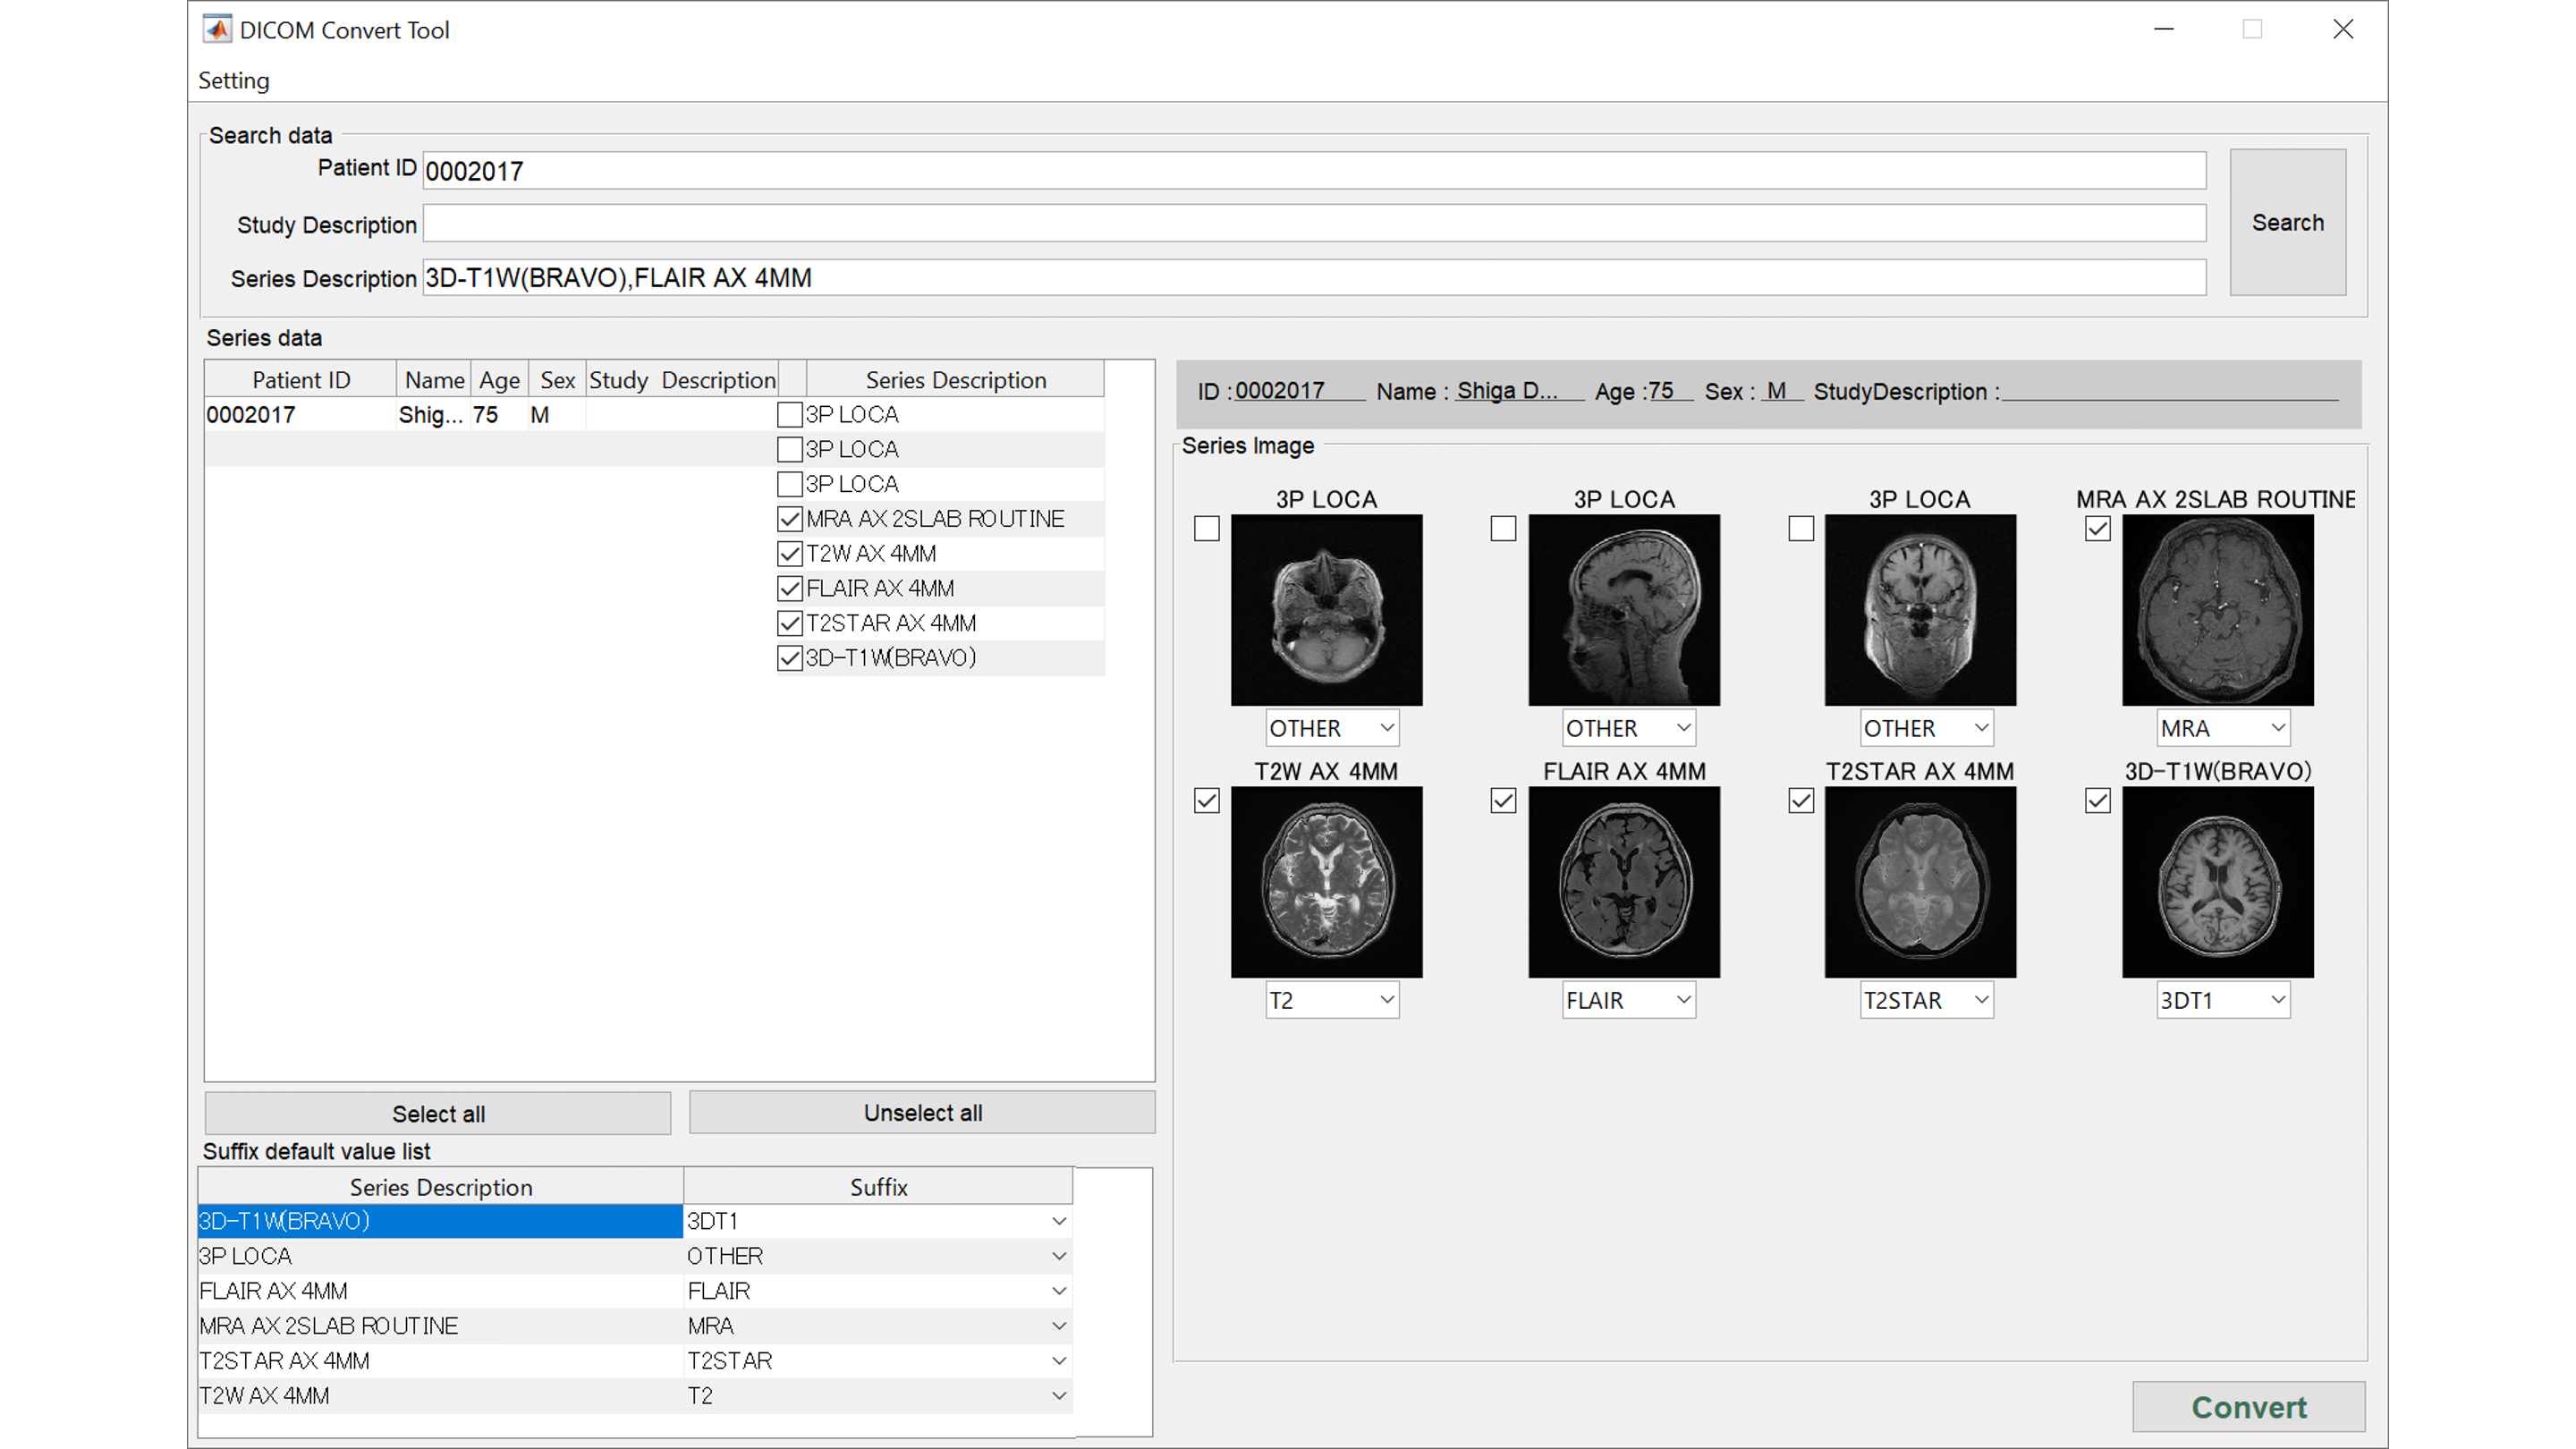
Multiple DICOM series will be presented as images. You can check 3DT1WI, FLAIR, T2WI, MRA, etc. and correct here if different.
Start to analyze
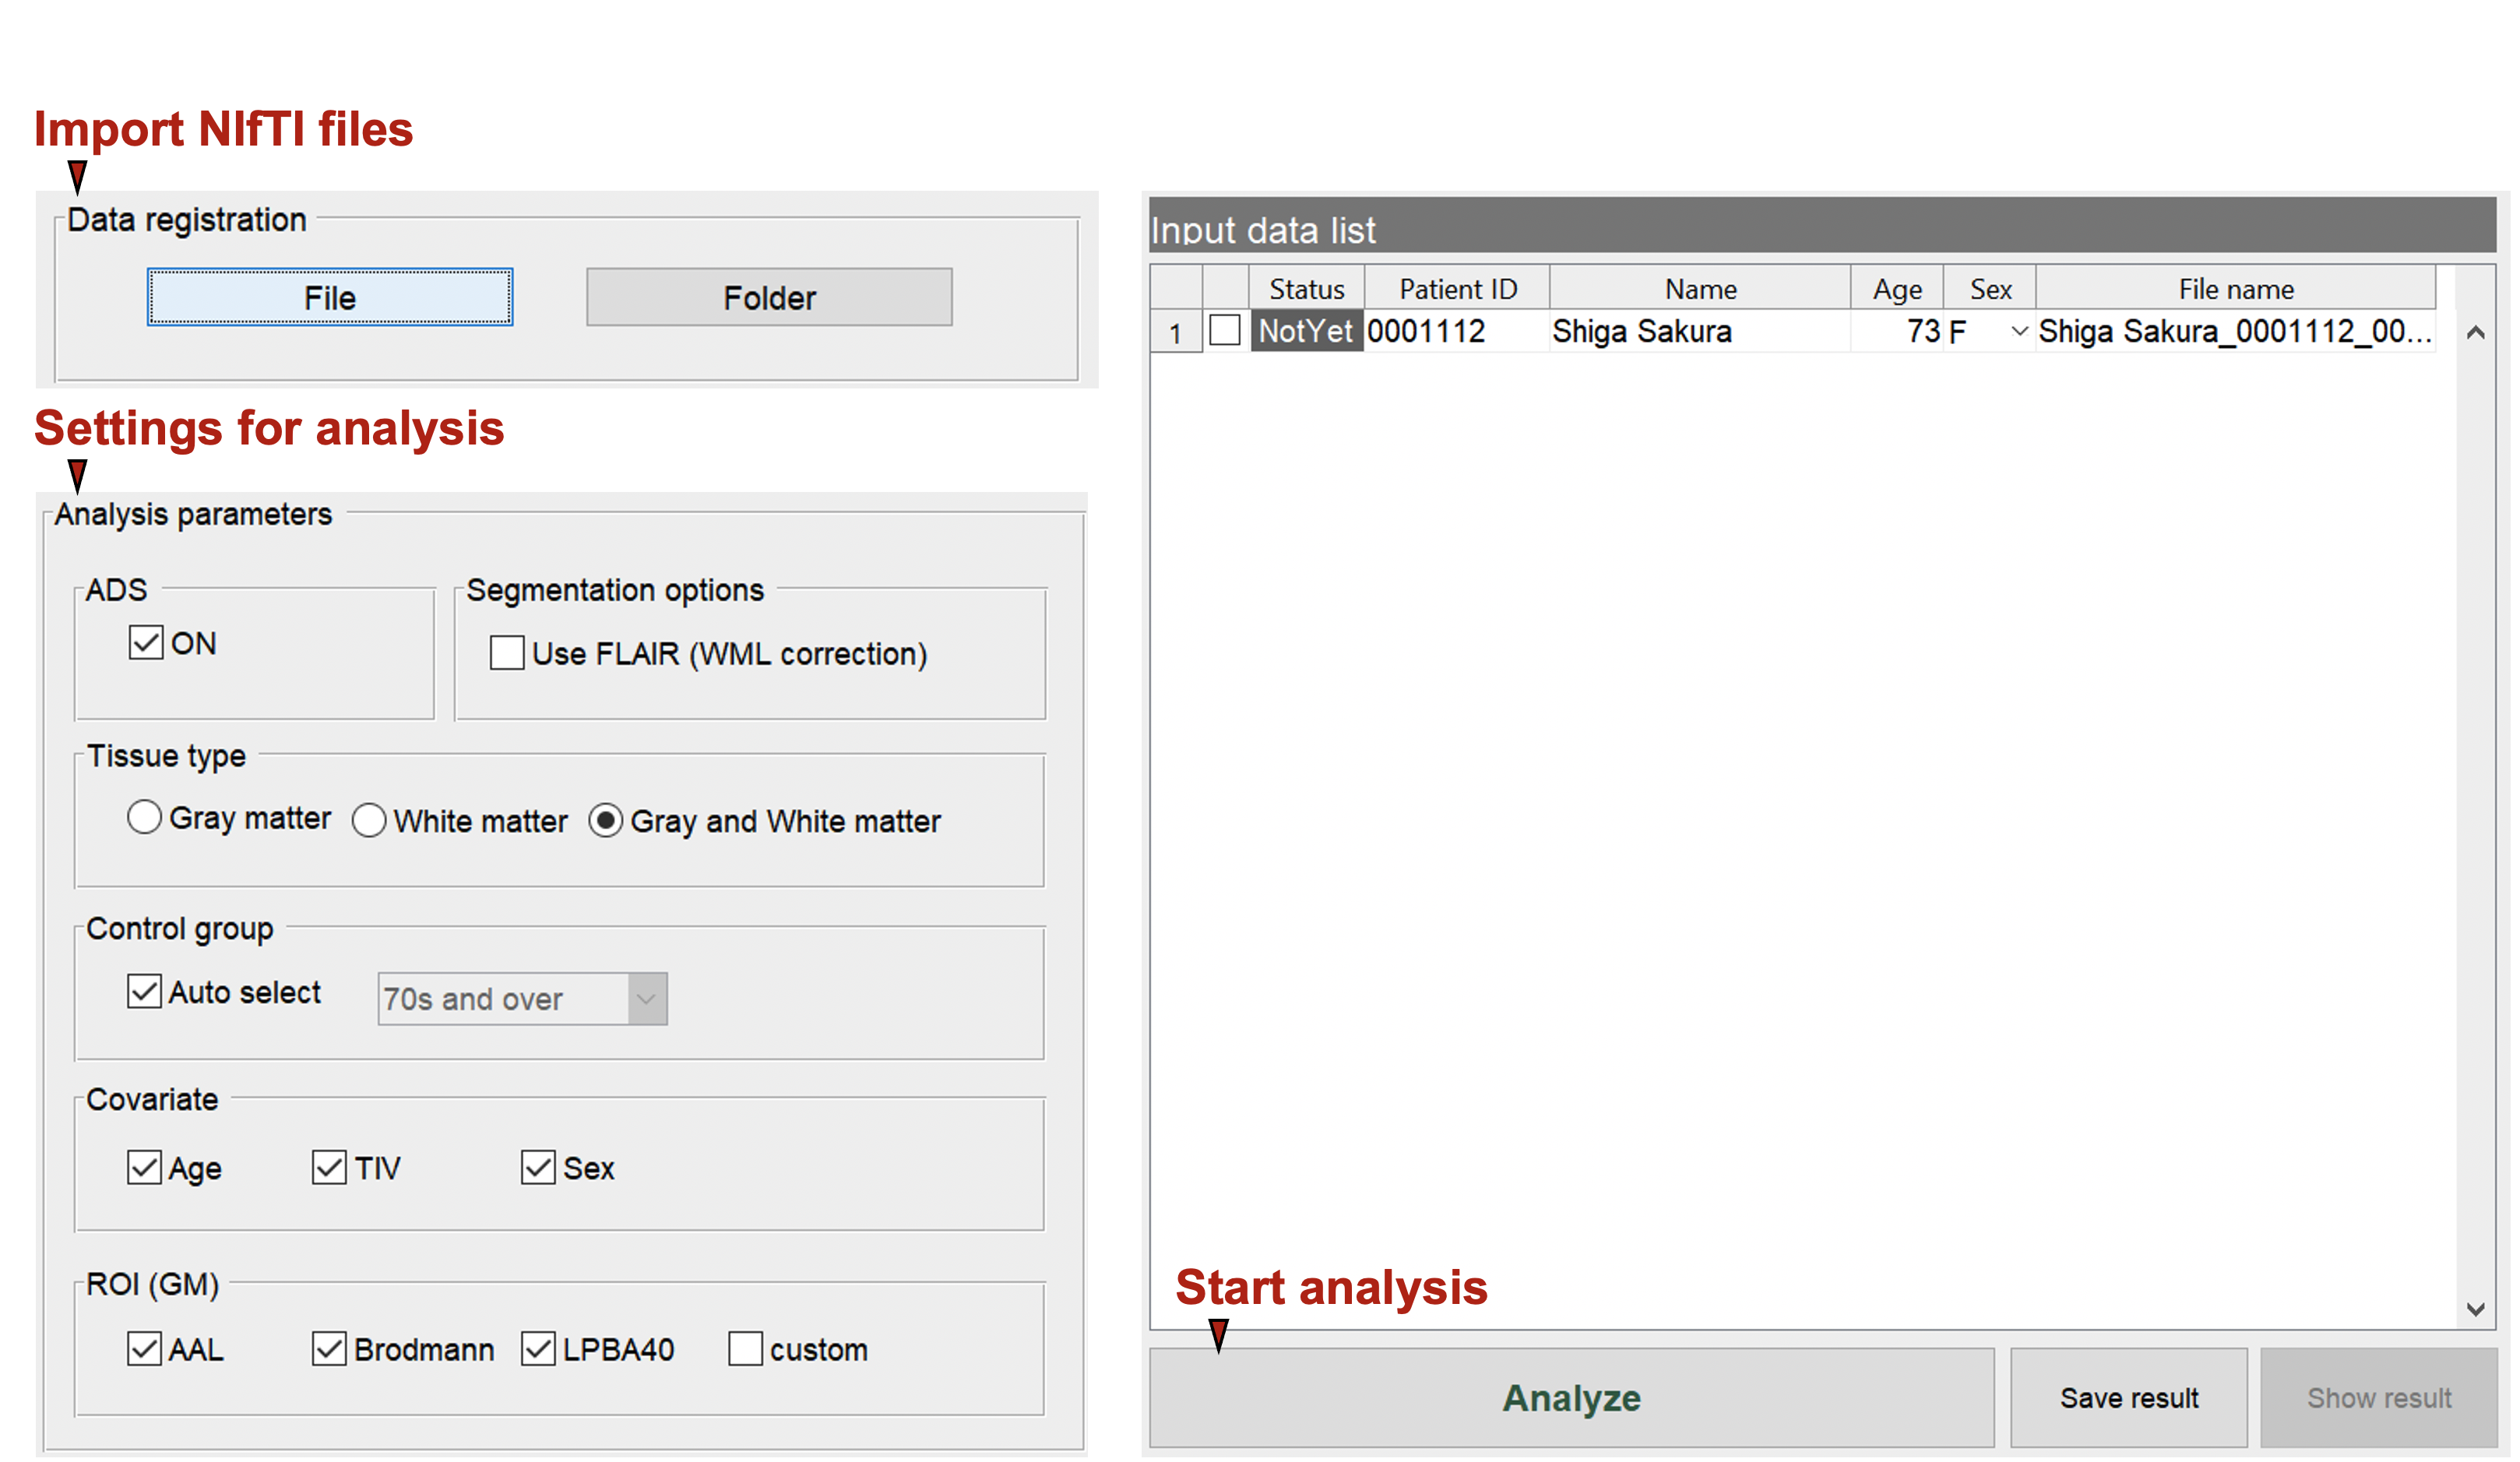
Specify The Analysis Settings. Here You Can Specify The Type Of Ai, Gray/White Matter Settings, Covariates, Control Group, And Atlas To Be Used.
Show the results
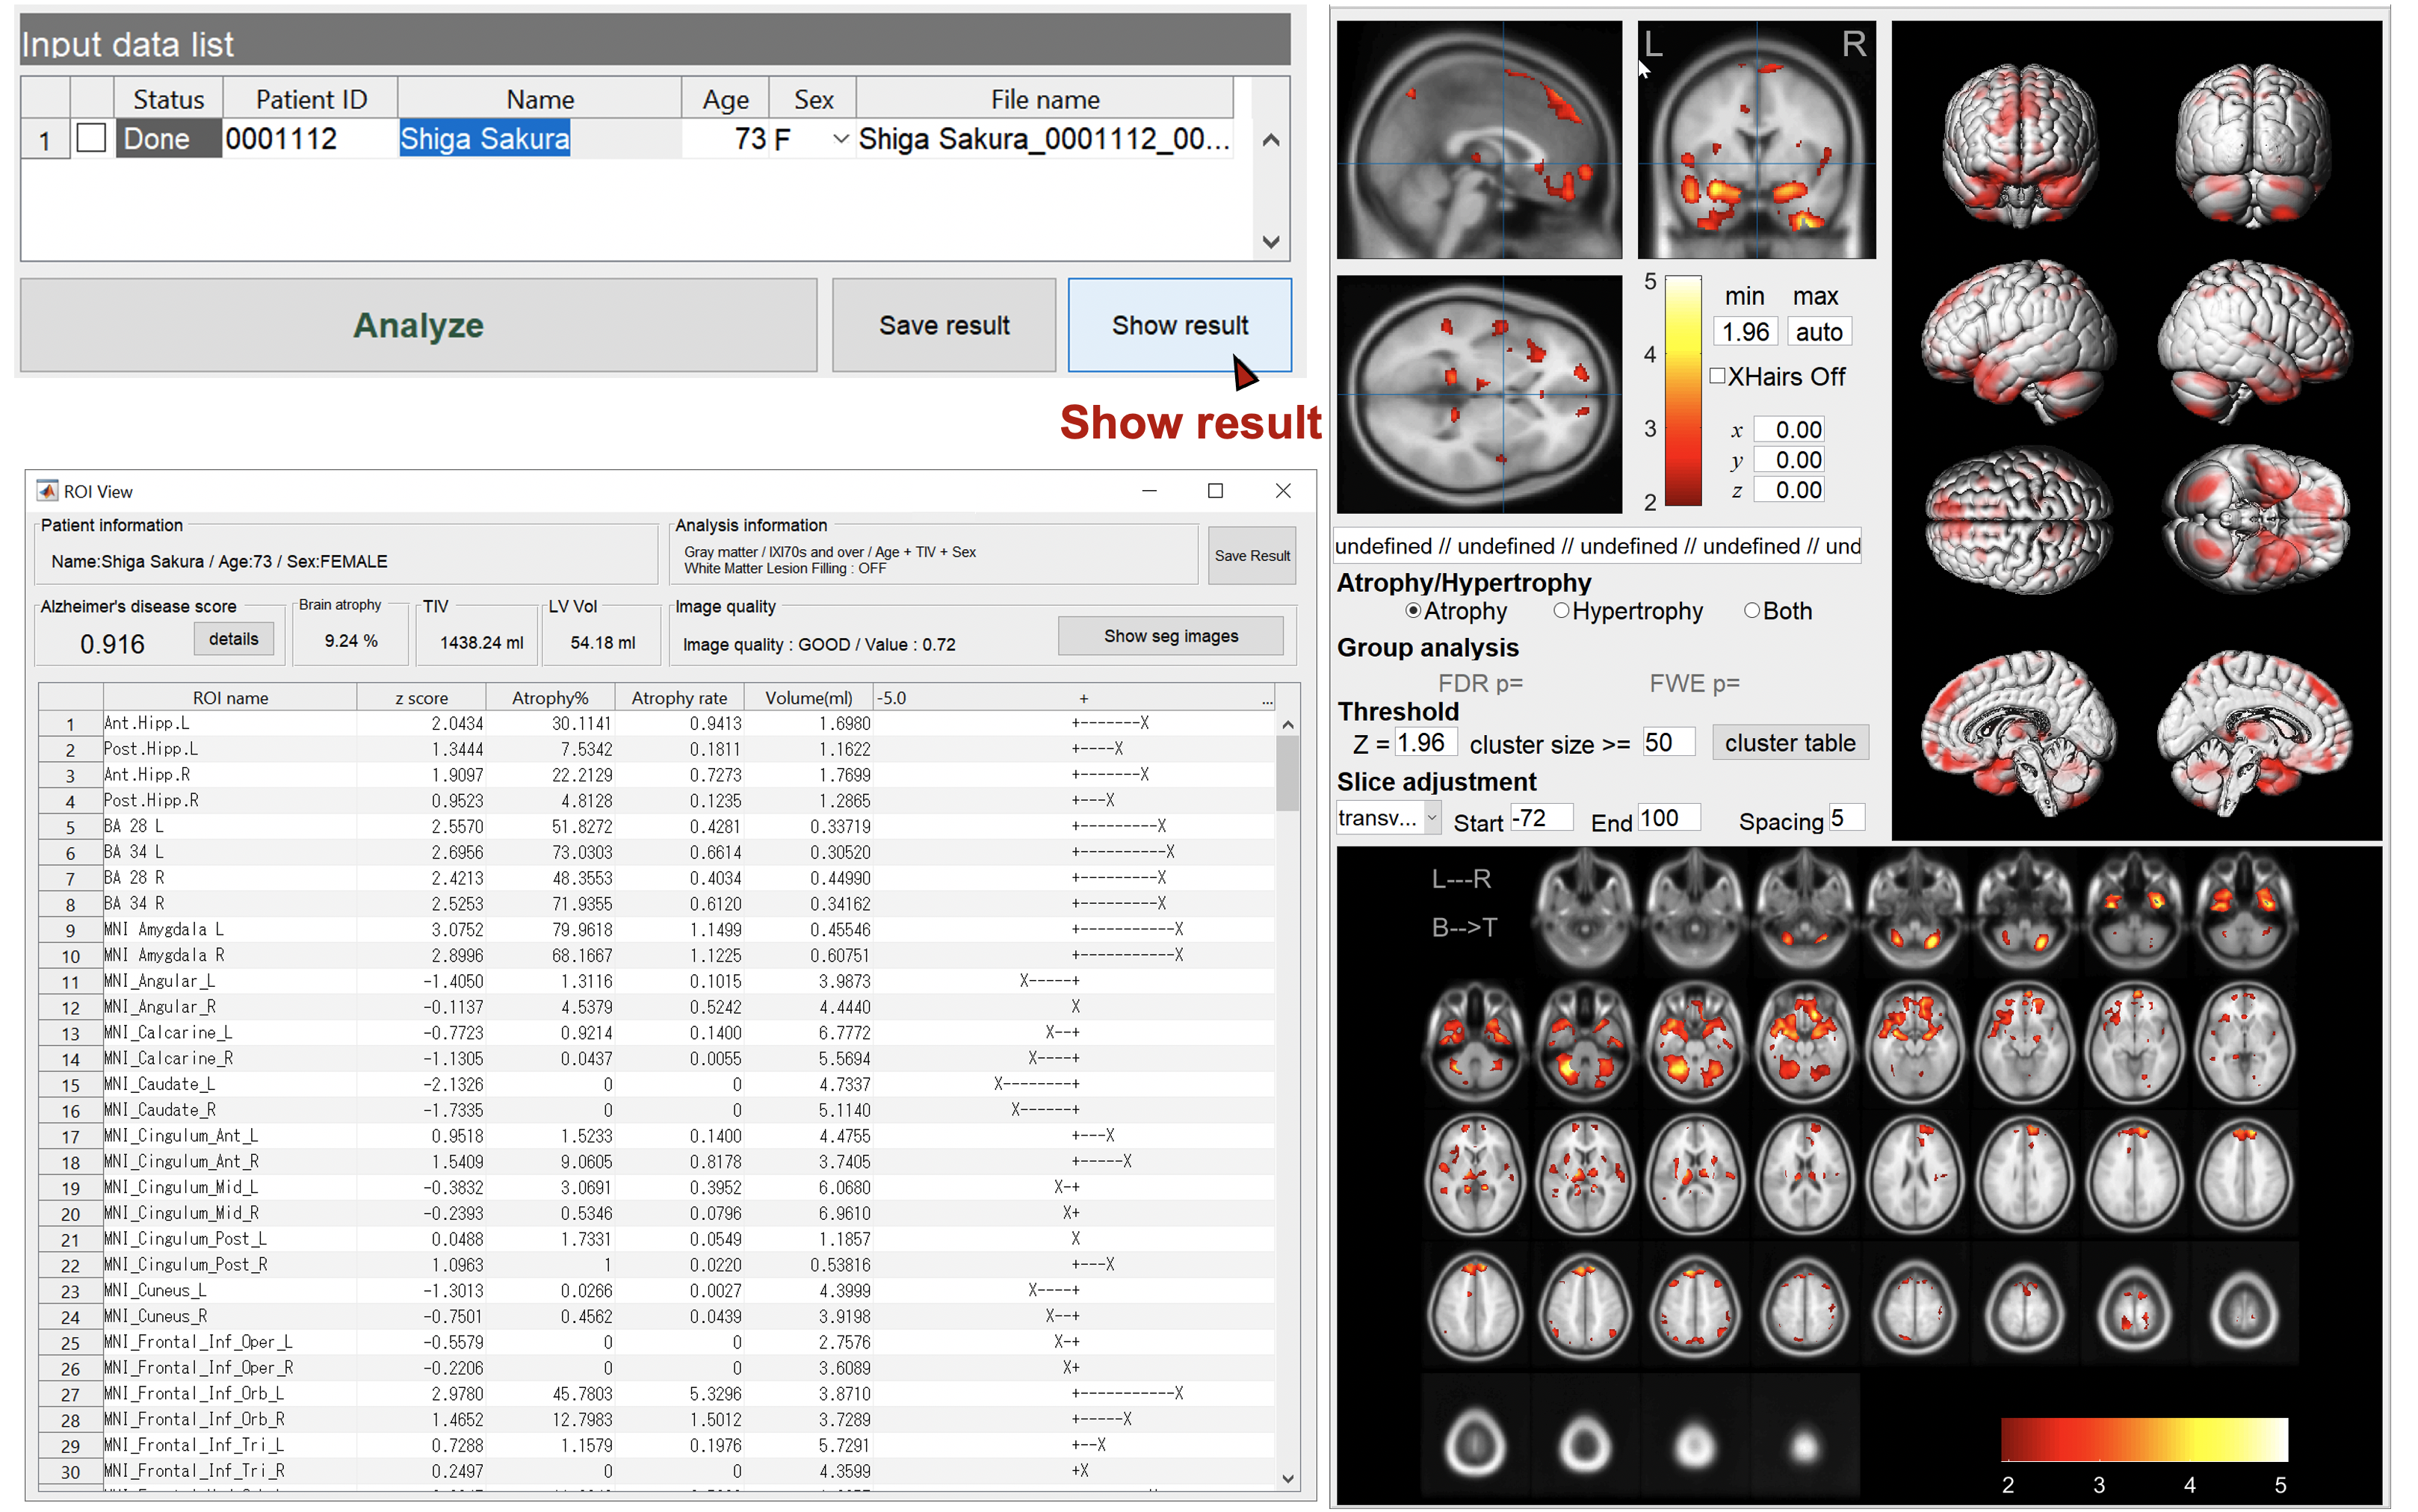
Specify the case to display the results. You can check the regions of brain atrophy and/or hypertrophy. You can change the threshold value, slice direction, slice interval, etc. FWE-correction by RFT is also available for intergroup tests.
Gray/White matter VBM

The results of AI for ADLS, VBM results for white matter as well as gray matter, white matter lesions and lateral ventricle volumes are also stored as PDFs.
Gray/White matter VBM
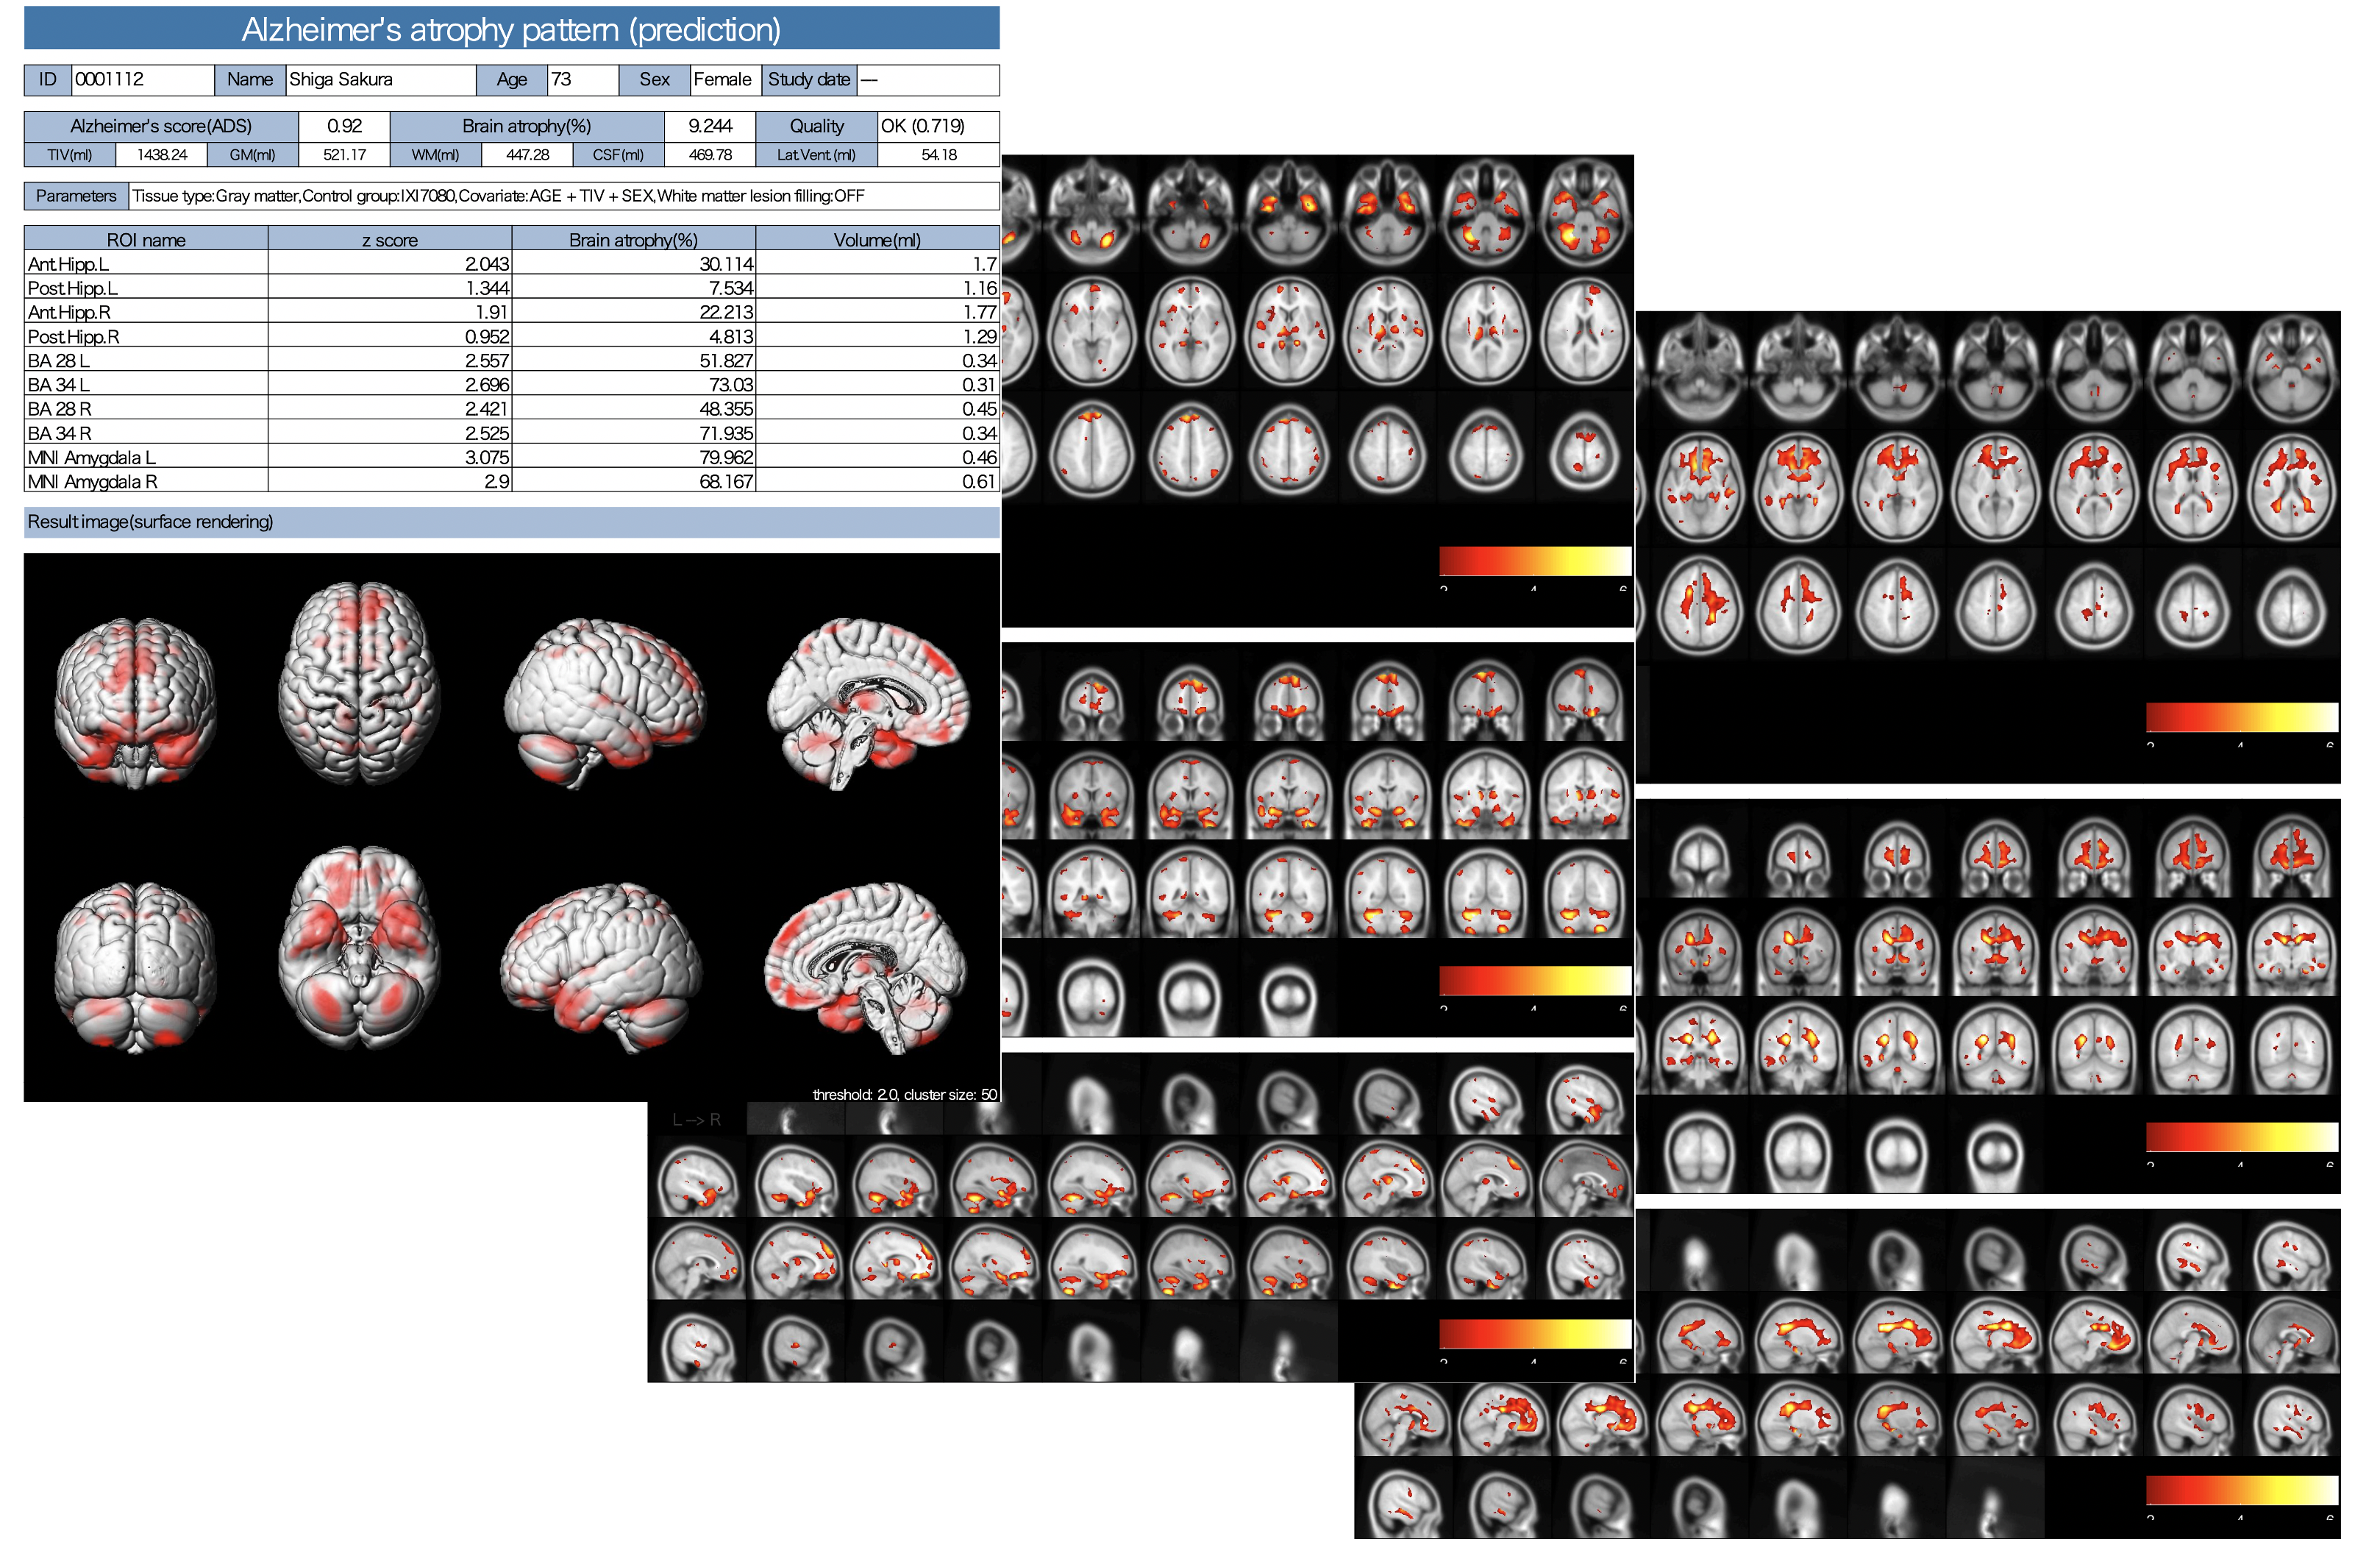
The results of AI for ADLS, VBM results for white matter as well as gray matter, white matter lesions and lateral ventricle volumes are also stored as PDFs.
Preparation for use
Preparation for use
It is useful to set up a DICOM receiver that receives DICOM files directly from the MRI console, and it is even more useful to introduce our BAAD server system. If you want to build your own DICOM receiver, you may use a free software such as Conquest DICOM software. It is also possible to read DICOM files from CDs. In some cases, it may be hard to import DICOM files from CD, because they may have been specially processed by each vendor. In such a case, try using BAAD's DICOM import function.
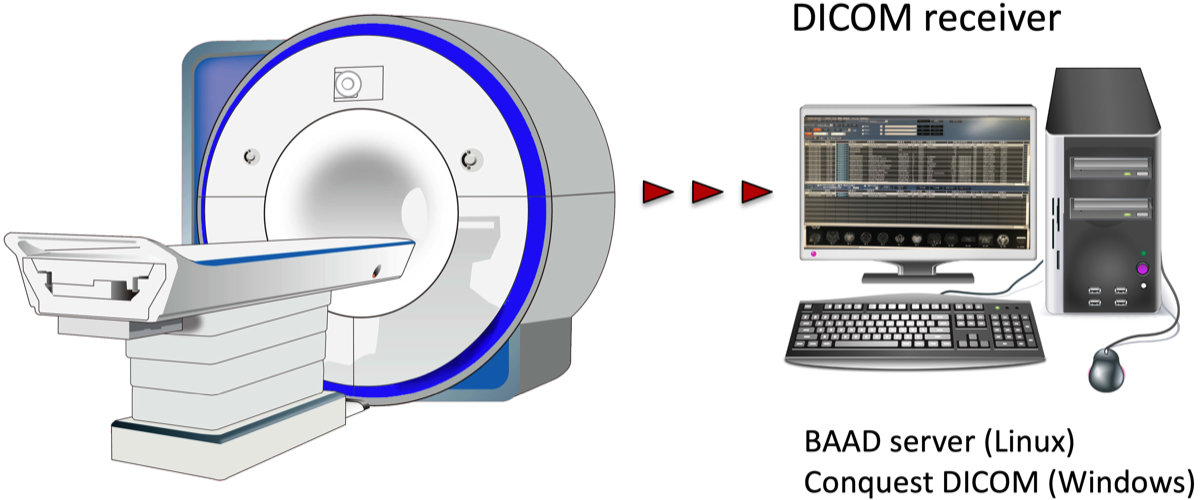
It is useful to set up a DICOM receiver that receives DICOM files directly from the MRI console, and it is even more useful to introduce our BAAD server system. If you want to build your own DICOM receiver, you may use a free software such as Conquest DICOM software. It is also possible to read DICOM files from CDs. In some cases, it may be hard to import DICOM files from CD, because they may have been specially processed by each vendor. In such a case, try using BAAD's DICOM import function.
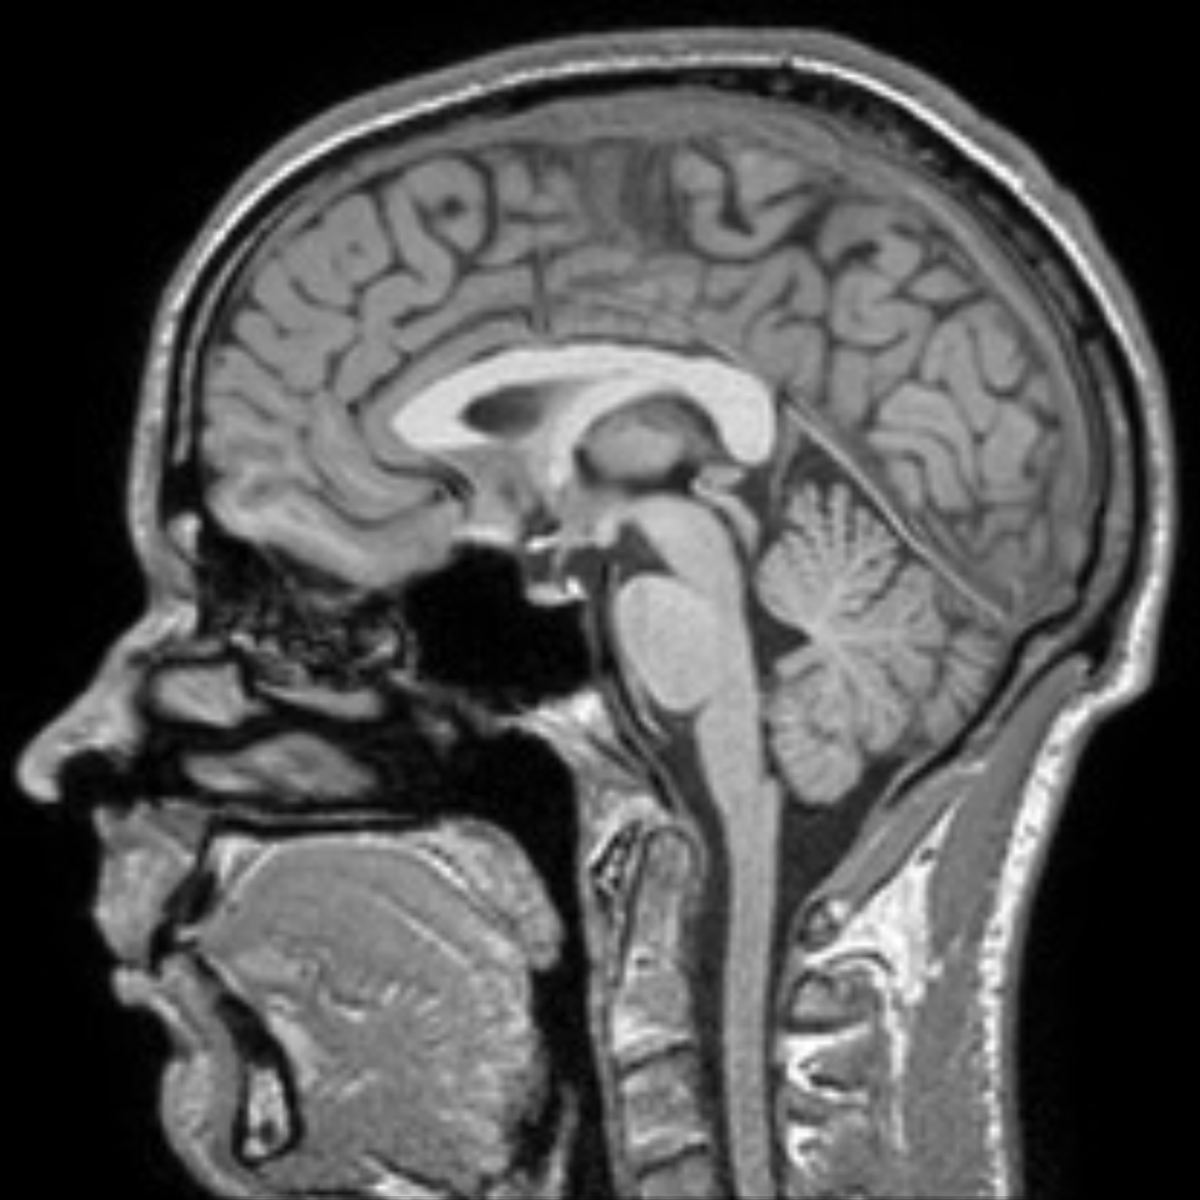
Since BAAD uses the IXI database, it is ideal to image under the same conditions close to the IXI dataset.
As the voxel size is 0.9375 x 0.9375 x 1.2 mm, it is better to take an image with a size close to 1 mm cubic. The T1-weighted three-dimensional MP-RAGE sequences is the standard and is often used: For example,
1.5T (Gyroscan): TR/TE=9.813/4.603, FA=8, FOV=240, 256x256x150
3.0T (Intera 3T): TR/TE=9.600/4.603, FA=8, FOV=240, 256×256×150
For 3D brain imaging, it is necessary to keep the high contrast between gray matter and white matter. Sagittal section is recommended, but horizontal and coronal sections can also be analyzed.
BAAD uses the Markov-MAP method for segmentation to accurately capture pathological changes. If FLAIR images are available (as thin slices as possible, gapless is better), they can be complemented with 3DT1 images to extract and correct white matter lesions. By the way, BAAD measures the volume of white matter lesions.
To manage the results of BAAD on a case-by-case basis, we have a BAAD server system that can work with BAAD clients and BAAD viewers to handle electronic medical records. You can build the system by yourself or get support from us. Please feel free to contact us.
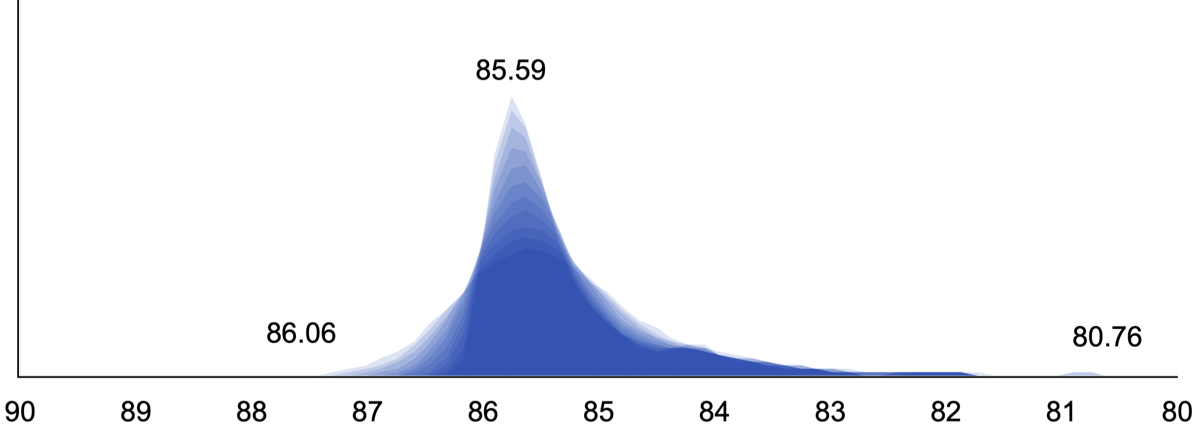
The right panel shows the image quality (IQR) results of the IXI database used as a control group for BAAD. The median is 85.59 and the range is from 86.06 to 80.76.
The bottom panel shows the IQR calculated as a weighted average from noise level, INU level, and image resolution. For more information, please refer to the CAT12 website. IQR gives you an idea of the quality of the MR image. An IQR of 80 or higher is considered good, if possible.
The panel below shows the image quality (IQR) results of the IXI database used as a control group for BAAD. The median is 85.59 and the range is from 86.06 to 80.76.
The next panel shows the IQR calculated as a weighted average from noise level, INU level, and image resolution. For more information, please refer to the CAT12 website. IQR gives you an idea of the quality of the MR image. An IQR of 80 or higher is considered good, if possible.
Up-to-date information
Up-to-date information
A paper related to BAAD has been published (please cite it for reference on the method).
Machine Learning for Diagnosis of AD and Prediction of MCI Progression From Brain MRI Using Brain Anatomical Analysis Using Diffeomorphic Deformation.
Syaifullah AH, Shiino A, Kitahara H, Ito R, Ishida M, Tanigaki K.
Front Neurol. 2021 Feb 5;11:576029. doi: 10.3389/fneur.2020.576029. eCollection 2020.
Machine learning of brain structural biomarkers for Alzheimer's disease (AD) diagnosis, prediction of disease progression, and amyloid beta deposition in the Japanese population.
Shiino A, Shirakashi Y, Ishida M, Tanigaki K; Japanese Alzheimer's Disease Neuroimaging Initiative. Alzheimers Dement (Amst). 2021 Oct 14;13(1):e12246. doi: 10.1002/dad2.12246. eCollection 2021.
Brain MRI as a Biomarker of Alzheimer’s Disease: Prediction of the Pathology by Machine Learning.
Ishida M, Syaifullah AH, Ito R, Kitahara H, Tanigaki K, Nagai A, Shiino A. J Alzheimers Dis & Parkinsonism. 2001.
A new version (ver. 5.0 beta) of BAAD will be released.
- Faster and more stable download (smaller size than before).
- Using geodesic shooting instead of Dartel.
- Calculate the extension of the white matter lesions (FLAIR images are required).
- Brain age estimation from brain volume and white matter lesions.
- Calculate the volume of lateral ventricles for hydrocephalus.
- Equipped with artificial intelligence (only Alzheimer's disease will be released at this time).
- Extending functions such as permutation, TFCE analysis, TBM, SBM, etc. are available.
A paper related to BAAD has been published (please cite it for reference on the method).
Machine Learning for Diagnosis of AD and Prediction of MCI Progression From Brain MRI Using Brain Anatomical Analysis Using Diffeomorphic Deformation.
Syaifullah AH, Shiino A, Kitahara H, Ito R, Ishida M, Tanigaki K.
Front Neurol. 2021 Feb 5;11:576029. doi: 10.3389/fneur.2020.576029. eCollection 2020.
Machine learning of brain structural biomarkers for Alzheimer's disease (AD) diagnosis, prediction of disease progression, and amyloid beta deposition in the Japanese population.
Shiino A, Shirakashi Y, Ishida M, Tanigaki K; Japanese Alzheimer's Disease Neuroimaging Initiative. Alzheimers Dement (Amst). 2021 Oct 14;13(1):e12246. doi: 10.1002/dad2.12246. eCollection 2021.
Brain MRI as a Biomarker of Alzheimer’s Disease: Prediction of the Pathology by Machine Learning.
Ishida M, Syaifullah AH, Ito R, Kitahara H, Tanigaki K, Nagai A, Shiino A. J Alzheimers Dis & Parkinsonism. 2001.
A new version (ver. 4.3) of BAAD has been released.
1. Faster and more stable download.
2. Automatically corrects for white matter lesions during segmentation (FLAIR images are required).
3. Calculates the volume of white matter lesions.
4. It can calculate the volume of lateral ventricles.
5. Equipped with artificial intelligence (only Alzheimer's disease is supported at this time).
6. Permutation, TFCE analysis, TBM, SBM, etc. are available.
Textbook for VBM
[Theory]
Bayes' theorem, maximum likelihood estimation, mutual information, Markov probability fields, linear models, statistics in SPM (multiplicity of tests, correction for multiple tests, test levels, permutation tests, TFCE), coordinate transformation
[Basics]
File format of image data, coordinate space of brain, preprocessing for analysis (AC-PC correction, correction of signal value inhomogeneity, tissue segmentation, Gaussian mixture model, warping to MNI space, difference between modulation and concentration, intracranial volume, volume calculation of cerebral white matter lesion) (volume calculation of cerebral white matter lesions), VBM, TBM, SBM, population intelligence
[Practice]
How to install and use BAAD (including how to manage data, how to create custom ROIs, etc.)
How to use SPM12 (VBM and TBM with SPM12, geodesic shoot, Dartel, conversion to MNI space, etc.)
SBM methods (VBM with CAT12, SBM methods, etc.)
Written in Japanese.
Textbook for VBM
[Theory]
Bayes' theorem, maximum likelihood estimation, mutual daughter cells, Markov probability fields, linear models, statistics in SPM (multiplicity of tests, correction for multiple tests, test levels, permutation tests, TFCE), coordinate transformation
[Basics]
File format of image data, coordinate space of brain, preprocessing for analysis (AC-PC correction, correction of signal value inhomogeneity, tissue segmentation, Gaussian mixture model, warping to MNI space, difference between modulation and concentration, intracranial volume, volume calculation of cerebral white matter lesion) (volume calculation of cerebral white matter lesions), VBM, TBM, SBM, population intelligence
[Practice]
How to install and use BAAD (including how to manage data, how to create custom ROIs, etc.)
How to use SPM12 (VBM and TBM with SPM12, geodesic shoot, Dartel, conversion to MNI space, etc.)
SBM methods (VBM with CAT12, SBM methods, etc.)